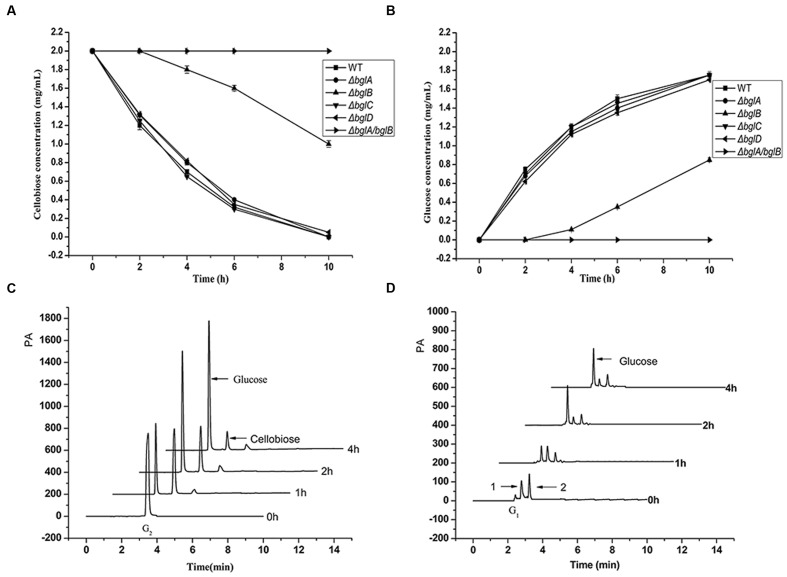
FIGURE 3.
Cellobiose utilization. (A,B) Cellobiose degradation by the wild type strain and the β-glucosidase deletion mutants in Na2HPO4–KH2PO4 buffer (pH 6.8). (A) The remaining cellobiose and (B) the generated glucose in the medium. Cells (50 μg of protein per milliliter) were incubated with 0.2% (wt/vol) cellobiose in Na2HPO4–KH2PO4 buffer, in which condition the cell concentration kept stable. Values are the mean of three biological replicates. Error bars are the standard deviations from these replicates. (C,D) Cellobiose utilization by the wild type strain in Stanier medium. (C) Cellobiose degradation products in the medium supernatant and (D) the accumulated cello-oligosaccharides in the cells. Cells (100 μg of protein per milliliter) were incubated with 0.2% (wt/vol) cellobiose in Stanier medium. There were two small peaks (peak 1 and peak 2) between the sites of the glucose peak and cellobiose peak in the cell sample. PA, peak altitude.

