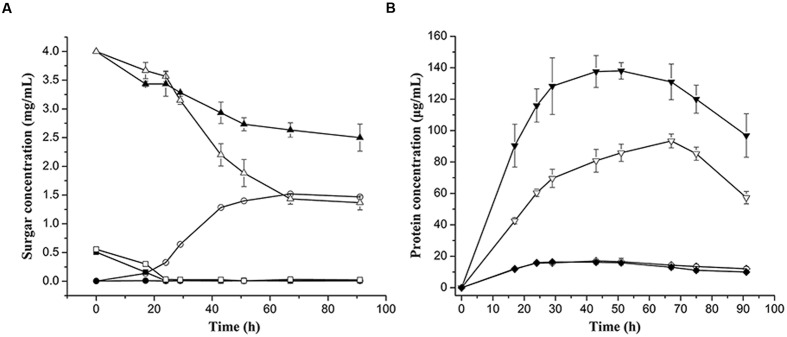
FIGURE 6.
Growth curves of the wild type strain and ΔbglA/bglB in 0.4 % (wt/vol) cellulose Stanier medium supplemented with 0.05% (wt/vol) glucose.
(A) Sugar concentration curves of glucose, cellobiose, and residual cellulose. The concentrations of glucose and cellobiose were measured by ion chromatography, and the concentrations of residual cellulose were determined by measuring the drying cellulose. Symbol indication:  , glucose;
  cellobiose;
  , cellulose. (B) Protein concentrations of wild type strain and ΔbglA/bglB. Symbol indication:
  , cells cultured in 0.4% (wt/vol) cellulose supplemented with 0.05 % (we/vol) glucose;
  , cells cultured in 0.05% (wt/vol) glucose. The closed and open symbols stand for samples of the wild type strain and ΔbglA/bglB, respectively. Values are the mean of three biological replicates. Error bars are the standard deviations from these replicates.

