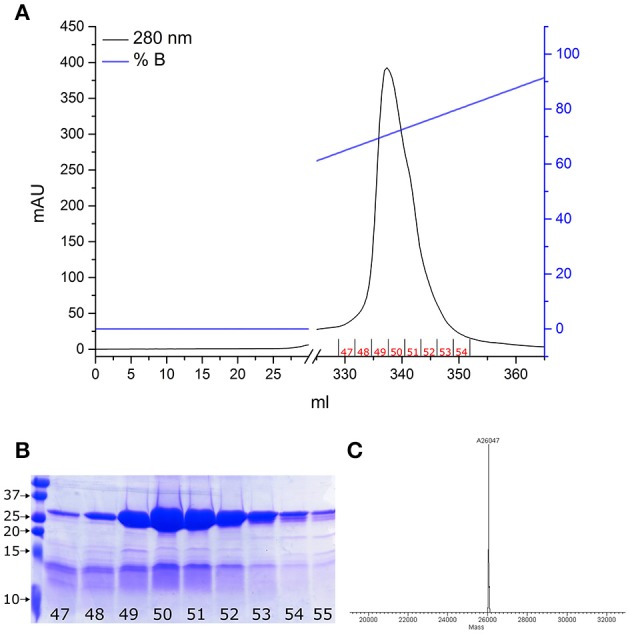
Figure 1.

proNGF-YBBR purification. (A) Chromatographic profile of FPLC analysis. Black line and blue line represents respectively the absorbance at 280 nm and the percentage of buffer B on the total flowing buffer. The numbers identifying the collected fractions are shown in red. (B) SDS-PAGE analysis of the collected fractions corresponding to the proNGF-YBBR peak. On the left side of the gel, molecular standard weights (kDa) are shown. Numbers of each lane correspond to the fraction analyzed. (C) MS analysis of the protein has revealed the presence of a unique species, corresponding to the full-length proNGF-YBBR.
