Fig. 2.

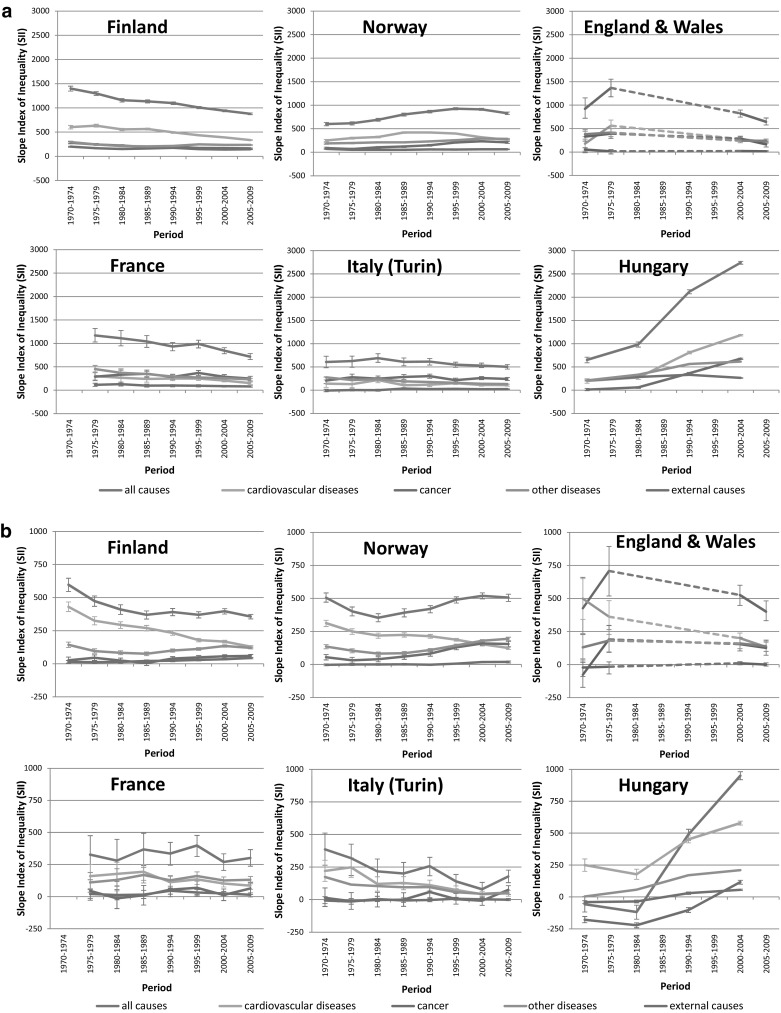
Trends in slope index of inequality for all-cause and cause-specific mortality by education, by country: a men, b women. In England and Wales, SIIs for the period 1980–1999 could not be calculated because ‘middle’ education was not available

Trends in slope index of inequality for all-cause and cause-specific mortality by education, by country: a men, b women. In England and Wales, SIIs for the period 1980–1999 could not be calculated because ‘middle’ education was not available