
Figure 2.
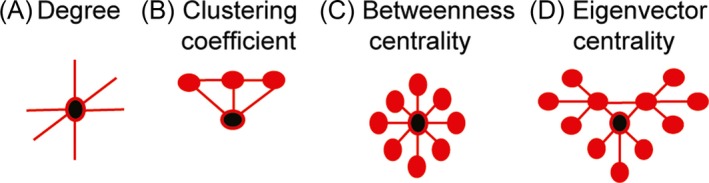
Schematic description of graph theory metrics. (A) Degree is the number of connections a brain region has. (B) Clustering coefficient indicates how highly connected a region is to its neighbors and (C) Betweenness centrality represents brain region network traffic. (D) Eigenvector centrality represents network traffic along the brains ‘busiest’ pathways. Black circles represent regions with high degree, clustering coefficient, betweenness centrality or eigenvector centrality. These graph theory metrics correspond to the graph metrics on the y‐axis of Figures 2, 3 and 4.