
Figure 4.
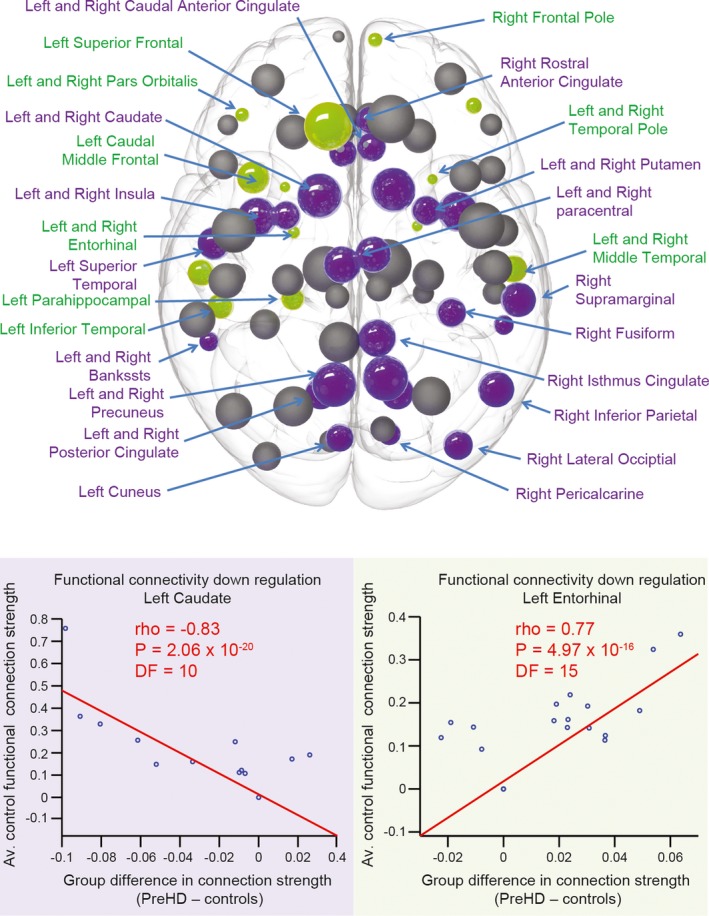
Functional regulation analysis. For each brain region in the average control network, correlations were performed against the strength of functional connection to all other 75 regions in the network (where a functional connection was present) and average group differences (pre‐HD minus controls) in these functional connections. Upregulation is defined as a positive correlation (stronger control connections show greater increases in pre‐HD), whereas downregulation is defined as a negative correlation (stronger control connections show greater decreases in pre‐HD). Brain regions that show significant positive (green) and negative (purple) correlations are highlighted. The size of the sphere represents the number of structural connections (thus largest spheres indicate hub brain regions). Correlation plots showing the brain regions with the most significant positive (green) and negative (purple) correlations are also displayed below. For each plot each data point represents a connection to the brain region specified. The strength of that connection for the avaerage control network, on the y‐axis, is plotted against the difference (pre‐HD minus controls) of that connection's strength on the x‐axis. The red line represents a least squares linear regression line. rho, correlation coefficient; DF, degrees of freedom.