
Fig. 3.
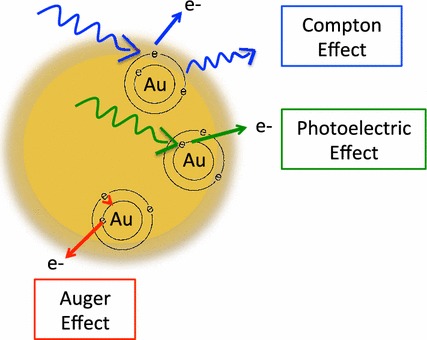
Schematic illustration of the photoelectric, Compton and Auger Effects. The Compton effect is represented in blue, the photoelectric effect in green and the Auger effect in red as described above
Official websites use .gov
A
.gov website belongs to an official
government organization in the United States.
Secure .gov websites use HTTPS
A lock (
) or https:// means you've safely
connected to the .gov website. Share sensitive
information only on official, secure websites.
Schematic illustration of the photoelectric, Compton and Auger Effects. The Compton effect is represented in blue, the photoelectric effect in green and the Auger effect in red as described above