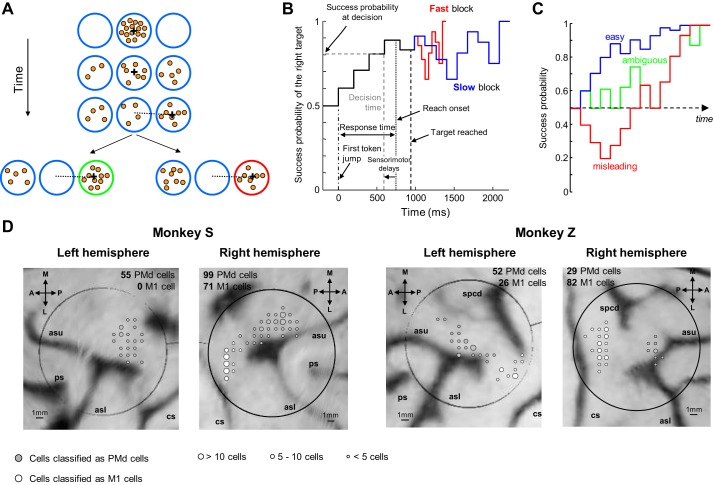
Fig. 1.
Methods and recording sites. A: the “tokens” task. Each row illustrates a step in an example trial (see text for details). If monkey chooses the target that receives most of the tokens at the end of the trial, this target turns green and a drop of juice is delivered to the animal (bottom left). If he chooses the other target, this target turns red and no reward is delivered (bottom right). B: success probability profile of an example trial. The probability of success of choosing each target evolves over time (black trace, for the right target in this example). After the chosen target is reached (vertical black dashed line), the remaining tokens jump either every 150 ms (in slow blocks, blue trace) or every 50 ms (fast block, red trace) to their allocated target. C: example success probability profiles of “easy,” “ambiguous,” and “misleading” trials, classified a posteriori according to predefined criteria (see materials and methods). D: reconstructed images of the brain surface from anatomical MRI scans. Large circles illustrate the location of the recording chambers. Gray-scaled circles illustrate the location of the recording sites for cells recorded in the 2 blocks of trials (232 cells in PMd, 175 cells in M1), classified as PMd or M1 based on anatomical location. A, anterior; P, posterior; M, medial; L, lateral; ps, principal sulcus; spcd, superior precentral dimple; asu, arcuate sulcus upper limb; asl, arcuate sulcus lower limb; cs, central sulcus.

