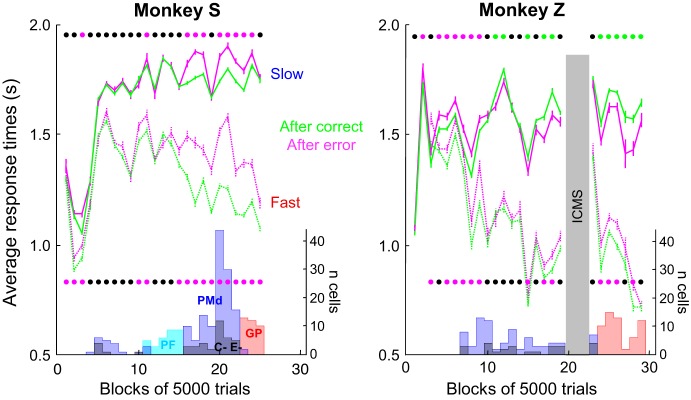
Fig. 11.
Monkeys' response times through practice and corresponding occurrence of recorded neurons. Each panel illustrates the evolution of monkey S (left) and monkey Z (right) mean (±SE) response times over the course of training in slow (solid lines) and fast (dotted lines) blocks. Within each block, trials are sorted according to the previous trial outcome, either a correct choice (green lines) or an error (magenta lines). Each bin represents the average response time calculated across 5,000 trials performed in either the fast or the slow blocks. Lines of dots show the results of statistical WMW tests performed on data within each bin to assess the significance of the effect of a correct choice vs. an error on the response time of the next trial in the slow (top line) and the fast (bottom line) blocks. Black dots show bins with no significant effect; green dots illustrate bins in which response times are significantly longer after a correct choice compared with an error. Magenta dots illustrate the opposite pattern. In monkey Z, bins of trials during which intracortical microstimulation (ICMS) sessions (data not shown) have been performed are excluded (gray vertical bar). At bottom of each panel, histograms illustrate the number of PMd (blue), PMd C and E (black), PFC (light blue), and globus pallidus (GP; red) cells recorded within each bin of 5,000 trials.

