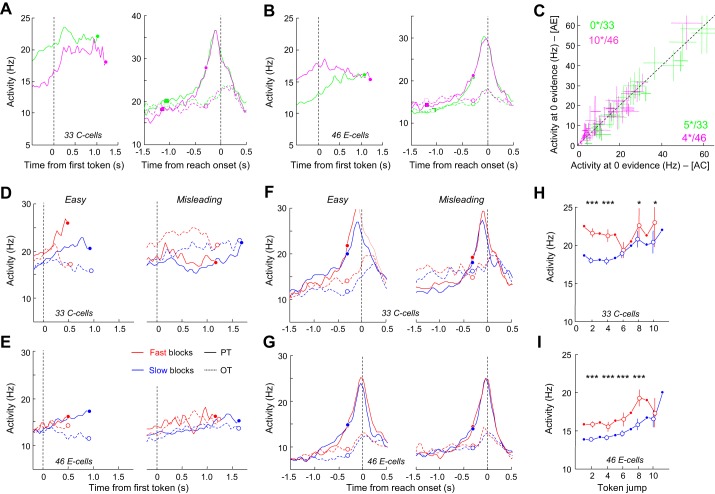
Fig. 12.
C cells and E cells in motor cortex. A: average response of 33 M1 C cells modulated in the fast condition but not necessarily in the slow condition. Activity is aligned on 1st token jump (left, PT- and OT-related averaged activity) or on movement onset (right, PT- and OT-related activity separated; same conventions as in Fig. 8) when monkeys performed the tokens task in the fast condition. Trials are sorted according to the previous trial outcome, either a correct choice (green) or an error (magenta). Circles illustrate commitment time, squares show 1st token jump. B: same as A for a population of 46 E cells modulated in the fast block but not necessarily in the slow condition. C: mean (±confidence intervals) activity after 3 token jumps of the 33 M1 C cells (green) and 46 M1 E cells (magenta) that were significantly modulated by previous trial outcome in the fast blocks but not necessarily slow blocks. Same conventions as in Fig. 7. D: average response of the population of 33 M1 C cells recorded in easy (left) or misleading (right) trials in slow blocks and fast blocks aligned on 1st token jump. Same conventions as in Fig. 9. E: same as D for a population of 46 E cells. F: same as D, but here activity is aligned on movement onset. G: same as F for the population of 46 E cells. H: evolution of the averaged activity of the 33 M1 C cells population calculated for the condition when SumLogLR = 0 (the evidence is equal for each target) as a function of time in either the slow (blue) or the fast (red) blocks. Same conventions as in Fig. 9E. I: same as H for the population of M1 E cells. *P < 0.05, ***P < 0.001.

