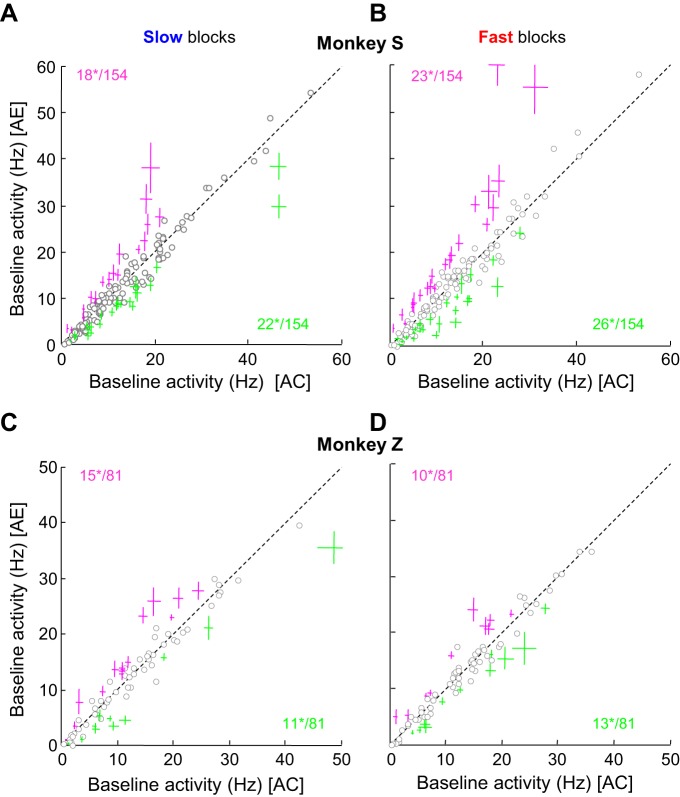
Fig. 4.
Cell-by-cell analysis of the effect of trial outcome on PMd baseline activity. A: within-cell comparison of the mean neural baseline activity (from −400 ms to 1st token jump) of a population of 154 PMd cells recorded in monkey S in trials following a correct choice (x-axis) or an error (y-axis) in the slow block of trials. Each circle represents the mean response of a neuron. Green crosses illustrate the cells (mean ± SE) for which baseline activity between the 2 conditions is significantly greater after a correct choice than after an error. These cells are referred as C cells in this report. Magenta crosses show the cells with the opposite effect, i.e., a significantly greater baseline activity after an error than after a correct choice. We refer to these cells as E cells in this report. Numbers indicate how many cells reach significance (*), as assessed through a WMW test. B: same as A for the fast block in monkey S. C: same as A for a population of 81 PMd cells recorded during the slow block in monkey Z. D: same as B for monkey Z.

