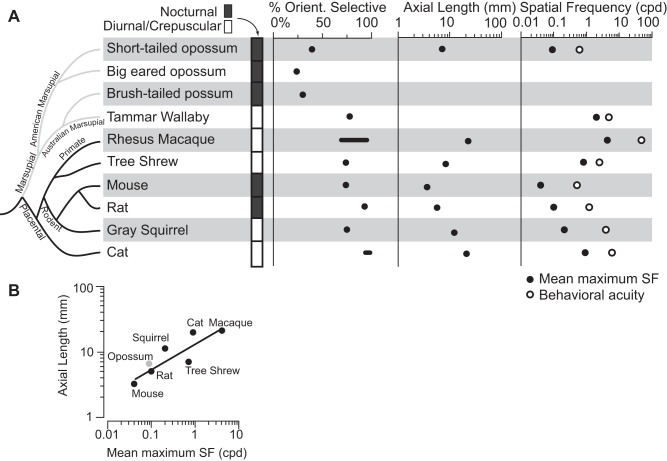
Fig. 10.
A: cladogram showing several mammalian species, the period of day in which they are active, and several features of a visual stimulus to which their neurons in V1 respond (left to right): active period, percentage of V1 neurons which are orientation selective, axial length of the eye, mean spatial frequency to which neurons are maximally responsive (left black dot), and behavioral visual acuity (right white dot). In the cladogram, marsupials are indicated with gray lines and eutherian mammals with black lines. Three of the four marsupials investigated have only a small percentage of orientation selective neurons in V1, with the exception of the diurnal (Tammar wallaby), which looks more like the tree shrew than other marsupials in most of the characteristics examined. For axial length of the eye and percentage of cells that are orientation selective, values are shown as either points (black dots) or a range of normal values (black line). Mean maximum spatial frequency (far right, black dot) is the average spatial frequency at which V1 neurons are maximally responsive for each species. White dots reflect the behavioral acuity measured in each species. These values were not available for Virginia opossums and Brush-tailed possums. B: data for the different species' axial length of the eye and spatial frequency of maximal neuronal response is plotted on the Y- and X-axis, respectively. Short-tailed opossums are plotted in gray and all other species (placental mammals) are plotted in black. When a trend line is fit to the data (solid line) short-tailed opossums remain consistent with the mammalian trend of eye size vs. acuity. Despite having a much lower proportion of orientation selective neurons in V1, the visual acuity of short-tailed opossums is similar to that with animals of a similar eye size, rather than being lower. Thus decreased orientation selectivity does not negatively impact short-tailed opossum's visual acuity measured in V1. Data for each species were obtained as follows: short-tailed opossum (present study, Dooley et al. 2012); big-eared opossum (Rocha-Miranda et al. 1973); brush-tailed opossum (Crewther et al. 1984); Tammar wallaby (Hemmi and Mark 1998; Ibbotson and Mark 2003); mouse (Niell and Stryker 2008; Park et al. 2013; Prusky et al. 2000); rat (Girmen et al. 1999; Mutti et al. 1998; Prusky et al. 2000); gray squirrel (Jacobs et al. 1982; Van Hooser et al. 2005); Rhesus macaque (De Valois et al. 1982; Foster et al. 1985; Kondo et al. 2006; Ringach et al. 2002; Sceniak et al. 2001); cat (Blake et al. 1974; Konrade et al. 2012; Maffei and Fiorentini 1973); tree shrew (Bosking et al. 1997; Phillips and McBrien 2004).

