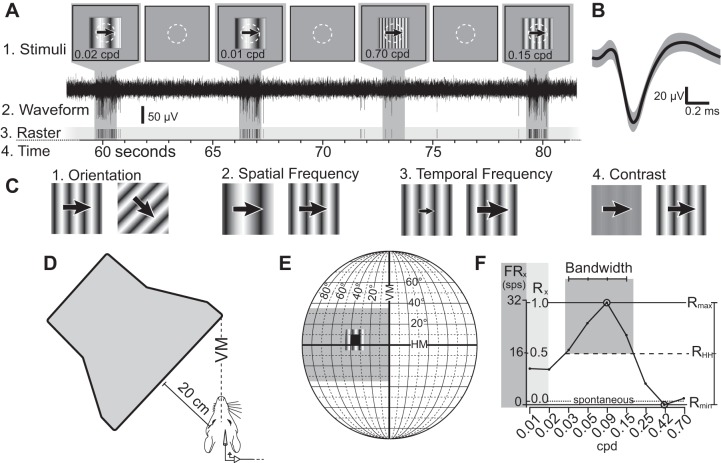
Fig. 2.
Presentation of stimuli during electrophysiological recording. Stimulus presentation (A1), waveform (A2), and raster plot (A3) over time (A4). A1: stimuli presented on the CRT, with neutral gray background and a 20° × 20° drifting sinusoidal stimulus. The neuron's receptive field is depicted by a white dotted circle. Between stimuli, only the neutral gray background was presented for 5 s. A2: electrophysiological waveform collected showing strong neuronal signal to background noise. A3: raster plot of single-unit action potentials collected during stimulus presentation. On this trial, the neuron did not respond above FRspon for the 0.70-cpd stimulus, was moderately responsive for the 0.01- and 0.02-cpd stimuli, and was highly responsive when presented with 0.15-cpd stimulus. B: average waveform for the putative unit shown in the raster in A, showing single unit isolation. Shaded region represents 1 SD from the mean. C: presented stimuli varied by orientation (C1), followed by spatial frequency (C2), temporal frequency (C3), and contrast (C4). D: top view of the animal and the monitor (not to scale). The computer monitor's leading edge was placed along the vertical meridian of the animal's visual field and covered 90° of the contralateral visual field. E: diagram of the visual field, showing the location of the monitor (gray box), an example of a receptive field spanning from 0° to 10° elevation and 30° to 40° azimuth (black box), and the 20° × 20° placement of the sinusoidal stimuli. F: example of a tuning curve of neuronal responses to different spatial frequencies. Y-axis shows responses in spikes per second (FRx, left, dark gray) and relative response rate (Rx, right, light gray). Rmax is defined as the stimuli to which neurons responded maximally (0.09 cpd in this example) and is set to equal 1. The spontaneous firing rate (dotted line) is the mean firing rate between stimulus presentations, and is the value where R = 0. In this example, Rmin < 0, as the response at 0.42 cpd is less than the spontaneous rate. RHH (dashed line) is the midpoint between Rmax and Rmin, whereas the bandwidth is the number of data points above RHH (4 in this example).

