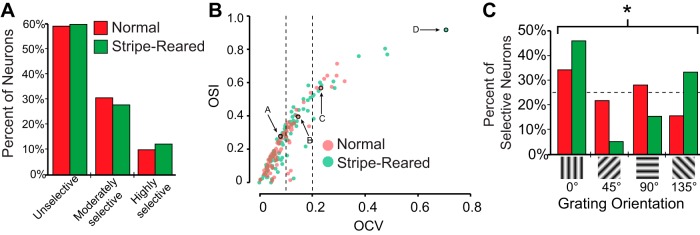
Fig. 5.
A: proportion of neurons classified as unselective (OCV ≤ 0.1), moderately selective (0.1 < OCV < 0.2), and highly selective (OCV ≥ 0.2) of normal (red) and stripe-reared (green) animals. B: scatterplot of OCV vs. OSI for normal (red) and stripe-reared (green) neurons. Data points encircled in black pointed out by arrows represent neurons depicted in Fig. 4. Neurons with higher OSI values generally had higher OCV values and were thus more selective. There were no significant differences in orientation selectivity for neurons in normal and stripe-reared animals. Dotted lines show thresholds for moderately and highly selective neurons. C: percent of moderately and highly selective neurons responsive to the four stimulus orientations presented for normal (red) and stripe-reared (green) animals. Stripe-reared animals showed an increase in the percentage of neurons responding to vertical gratings, which significantly differed from normal animals (*P < 0.05).

