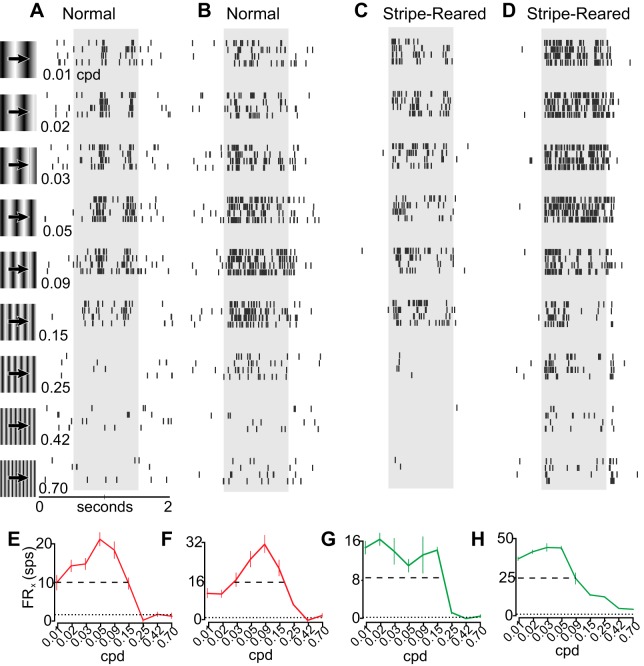
Fig. 6.
Examples of cells responding to different spatial frequencies in normal animals (A, B) and stripe-reared animals (C, D). Data are illustrated as in Fig. 4, with spatial frequency varying instead of orientation. Rasters are representative examples of a band-pass neuron found in a normal animal with phasic firing at preferred spatial frequencies (A), a band-pass neuron with continual firing at a range of spatial frequencies (B), a low-pass neuron found in a stripe-reared animal (C), and a low-pass neuron from a stripe-reared animal which continued to be driven at the highest spatial frequencies tested (D). E–H: tuning curves of the firing rate (FRx) from the neurons shown in A–D. Responses are shown as FRx ± SE. Data from normal animals are drawn in red and from stripe-reared animals in green. Dotted line illustrates FRspon; dashed line illustrates RHH.

