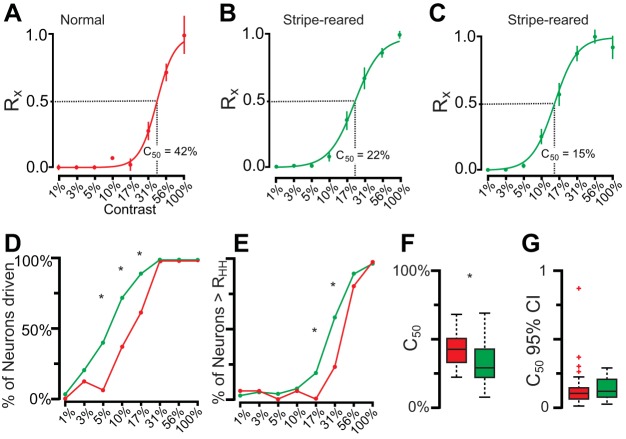
Fig. 9.
A: a response in a normal animal for presentation of different stimulus contrasts (Rx) ± SE. This neuron begins responding at 10% contrast and continues to fire for all contrasts up to 100% contrast. The sigmoidal fit of this neuron's response is shown, along with the C50 (42%). B: a response for a typical neuron in a stripe-reared animal for presentations of different stimulus contrasts. Neurons in stripe-reared animals had a sigmoidal response similar to that seen in normal animals, but the profile was shifted to the left, with the rising phase beginning at 5% contrast rather than 10% contrast. C: more infrequently encountered sigmoidal response for neurons in stripe-reared animals. This neuron saturated at a much lower contrast value compared with the neurons shown in A and B. D: the percentage of neurons being driven at different contrasts for stripe-reared (green) and normal (red) animals. At all contrast levels tested, neurons from stripe-reared animals had a higher probability of being driven than normal animals. E: the percentage of neurons firing above RHH for different contrasts in normal and stripe-reared animals. F: box and whisker plot of C50 values of all neurons from normal (red) and stripe-reared (green) animals. G: the 95% confidence intervals of C50 for normal and stripe-reared animals. For F and G, box includes 25th through 75th percentiles, whiskers include all values outside of outliers (colored crosses). C50 values are significantly lower for stripe-reared animals. In D and E, *P < 0.00625; in F, *P < 0.05. Both the percentage of neurons being driven and firing above RHH at different contrast values, as well as the C50 values, support the observation that neurons in stripe-reared animals are responsive to lower contrast values, and are more likely to saturate at lower contrast levels.

