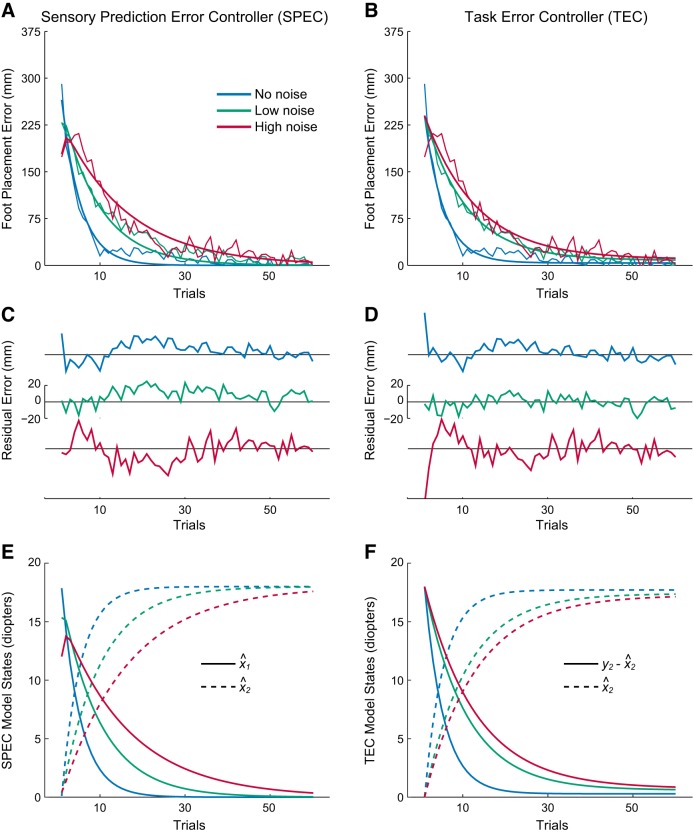
Fig. 4.
Model fits of foot placement error mean adaptation profiles, residuals, and model states for no-noise (blue), low-noise (green), and high-noise (red) conditions. A: SPEC model fits. B: TEC model fits. C: SPEC model residuals. D: TEC model residuals. E: SPEC model estimates for target location x^1 and mean prism shift x^2. F: TEC model correction term x^2 and difference between sensed line position y1 and the correction term.

