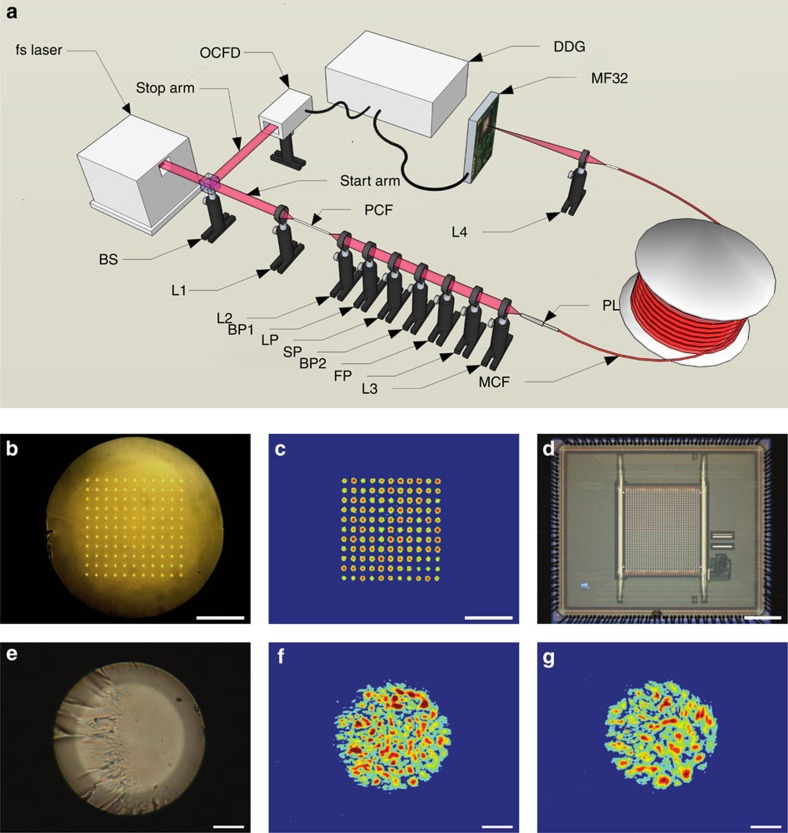
Figure 2. Experimental set-up and key components of the multiplexed single-mode wavelength-to-time-mapping system.
(a) Experimental set-up used for multiplexed single-mode wavelength-to-time mapping. (b) Micrograph of the MCF, showing the 11 × 11 square array of single-mode cores. Scale bar (also in c), 50 μm. (c) False colour image of the output of a 9 m length of MCF when coupling 532 nm light into a PL at the opposite end. (d) Micrograph of the Megaframe detector (MF32) with 32 × 32 SPADs. Scale bar, 800 μm. (e) Micrograph of the multimode end of a PL. Scale bar (also in f,g), 10 μm. (f,g) False colour images of different output intensity profiles from e when exciting different single-mode MCF cores at the opposite end of the PL using 532 nm light.

