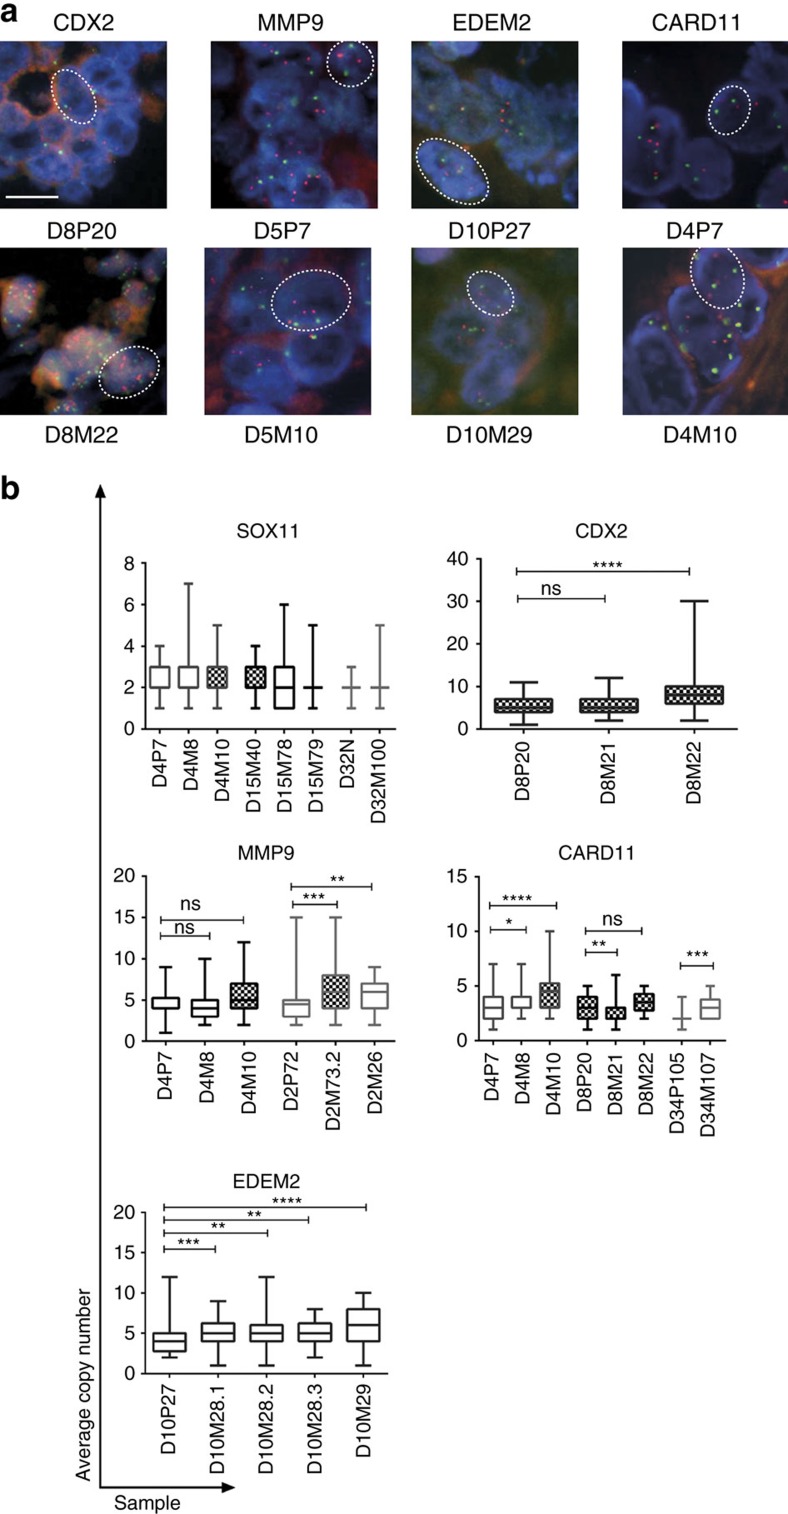
Figure 4. FISH analysis of inter-tumour heterogeneity.
(a) Representative FISH for CDX2, MMP9, EDEM2 and CARD11 in orange and centromeres of individual chromosomes in green. Scale bar depicts 10 μm. (b) Quantification of FISH using probes for CDX2, MMP9, CARD11 and EDEM2 reveals differential gene copy numbers between matched primary and metastatic samples. A SOX11 probe was used as a control. 50 cells randomly selected were counted in each sample. The distribution of signals per sample is depicted. Checkered boxes indicate samples from tumour exposed to chemotherapy. Wilcoxon signed rank test, *P<0.05, **P<0.01 and ***P<0.001. Box shows 25th and 75th percentiles and sample median as horizontal line, whiskers show maximum and minimum points.

