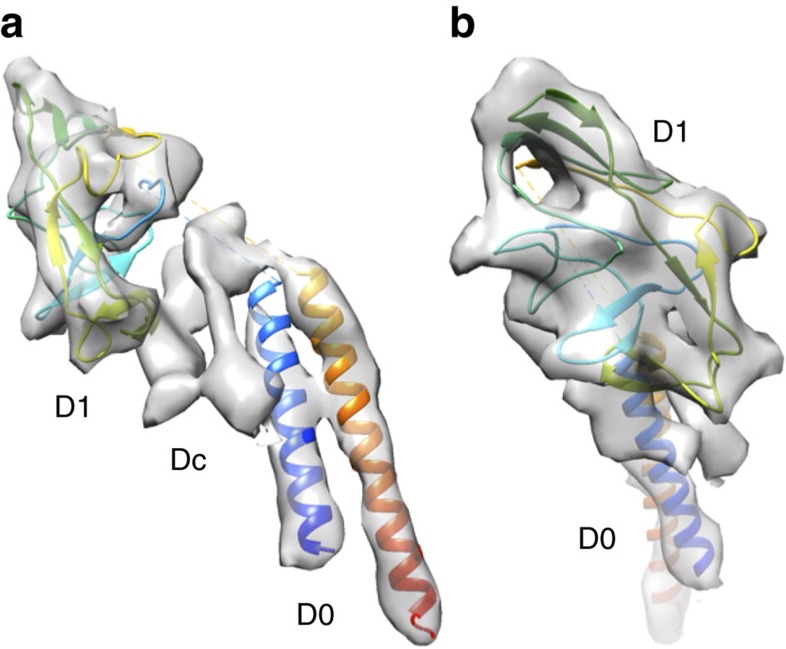
Figure 5. A magnified density map of a FlgG subunit to show the model fit.
(a) A side view showing domains D0, Dc and D1; (b) a view from outside of the rod by 90° rotation of the map and model shown in a. The N- and C-terminal α-helices, which form the inner core domain D0, are coloured blue and red, respectively, and the chain in domain D1 is coloured in rainbow. The domain connecting D0 and D1 is labelled Dc, as was designated in the hook structure12.

