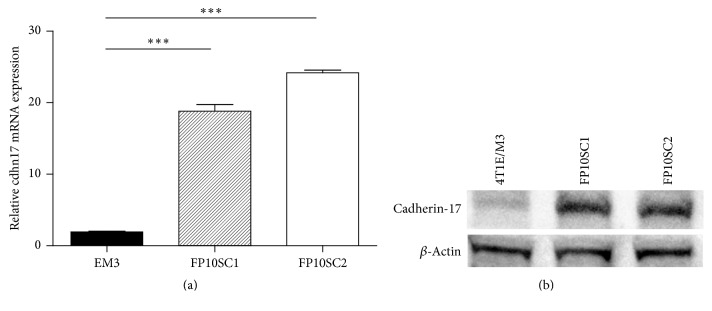
Figure 4.
Expression of cadherin-17 in 4T1E/M3, FP10SC1, and FP10SC2 cells. (a) Quantitative real-time RT-PCR (qRT-PCR) analysis of cadherin-17 expression in 4T1E/M3, FP10SC1 and FP10SC2 cells. Levels of cadherin-17 mRNA are shown relative to that of GAPDH mRNA. Values are means ± SD; ∗∗∗p < 0.001. (b) Western blot analysis of cadherin-17 in lysates of 4T1E/M3, FP10SC1, and FP10SC2 cells.

