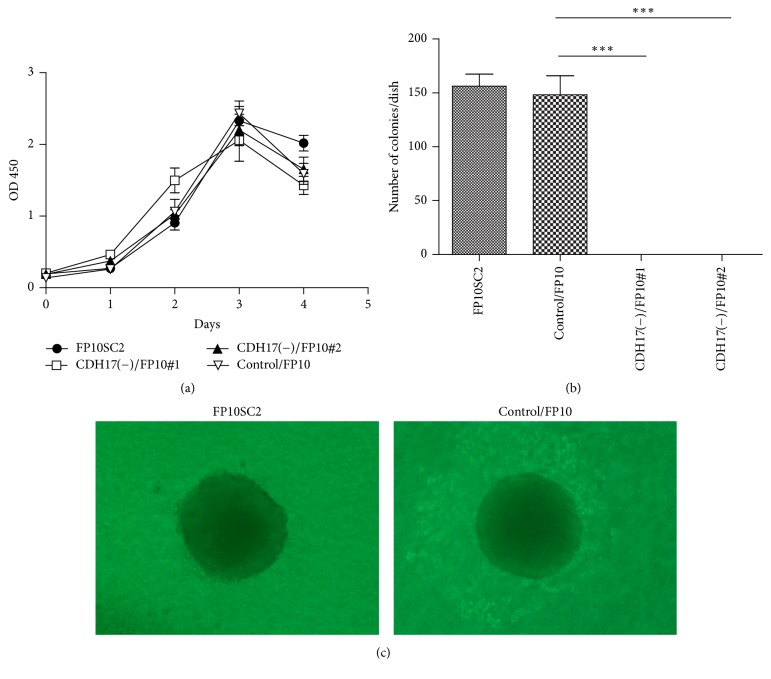
Figure 7.
Growth curves and anchorage-independent growth of FP10SC2 cells, control/FP10SC2, CDH17(−)/FP10SC2 clone #1, and CDH17(−)/FP10SC2 clone #2. (a) Growth curves for the indicated cells measured in MTT assays. Data are means ± SD. (b) Anchorage-independent growth of the indicated cells measured in colony formation assays. Cells (1 × 10⁴/dish, 3 dishes/cell type) were cultured for 12 days in medium containing 0.3% agarose layered on 0.5% agarose. Data are means ± SD; ∗∗∗p < 0.001. (c) Representative images of colonies.

