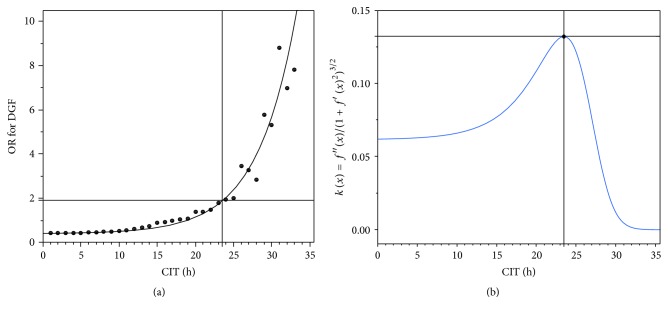
Figure 2.
(a) Increments of odds ratios (OR) for delayed graft function were calculated and plotted per increment of CIT-hours. A mechanistic asymptotic regression function f(x) = A · (1 + k · e(I · x)) (A = asymptotic, k = scale, and I = increment) with best estimated fit was chosen for further calculations. The function f(x) = 0.4175662 · (1 + 0,035169 · e(0.196467 · x)) (black line) was finally identified with lowest SSE = 10.3141 and best R2 = 0.94 (a). (b) The point of highest acceleration in risk increment was then calculated by insertion of the regression equation f(x) = 0.4175662 · (1 + 0,035169 · e(0.196467 · x)) into the curvature formula k(x) = f′′(x)/(1 + f′(x)2)3/2 with kmax. = 0.13 to 23.5 hours at an odds ratio of 1.9 (cross hairs at black (a) and blue lines (b)). The calculated CIT cut-off of 23.5 h was then used in univariable regression analysis to calculate the risk of delayed graft function development for CIT > 23.5 h to a hazard ratio of 3.713 (CI 2.215–6.225; p < 0.001).

