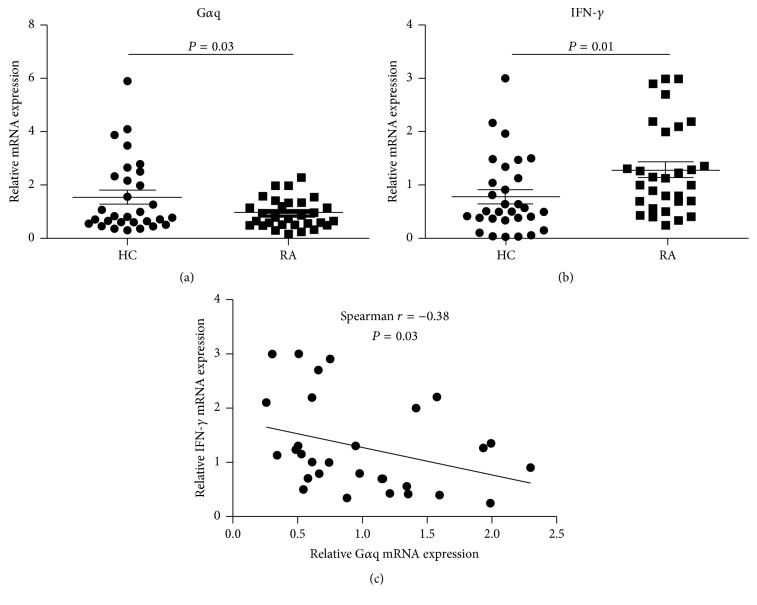
Figure 1.
Correlation of mRNA expression level of Gαq and IFN-γ. The mRNA expression of Gαq and IFN-γ was detected by real-time PCR. Relative (a) Gαq and (b) IFN-γ mRNA expression in PBMCs from patients with rheumatoid arthritis (RA; n = 30) and healthy controls (HC; n = 30). Bars show the mean and standard deviation (SD). P value was determined by Mann–Whitney test. (c) The correlation between Gαq mRNA expression level and IFN-γ mRNA expression level in RA patients (n = 30) was determined by using Spearman test.

