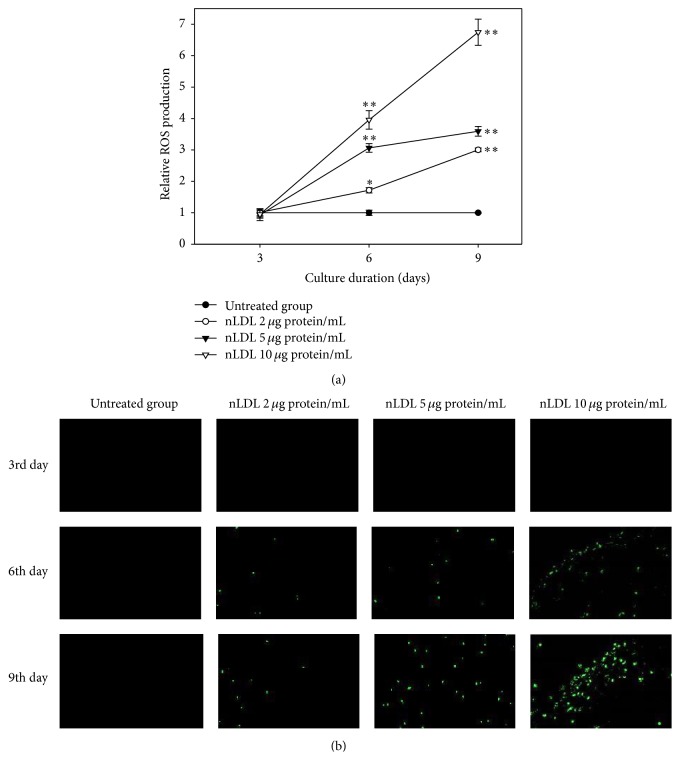
Figure 6.
The generation of reactive oxygen species (ROS) with nLDL in HUVECs. The cells were subcultured and treated with nLDL (0, 2, 5, and 10 μg protein/mL) every 3 days of each subculture, for up to 9 days. ROS generation in nLDL-treated cells were analyzed by spectrofluorometry (a) and fluorescence microscopy (b) assays with DCF-DA at the end of each subculture. ROS generation was expressed as the relative fluorescence intensity/μg of protein of the nLDL-treated group, as compared to the untreated group. The dose- and time-dependent differences in ROS generation (a) between groups were analyzed statistically by repeated measures ANOVA assay (p < 0.01). Each nLDL-treated group was also compared with the respective nLDL-untreated group by independent t-test (∗p < 0.05 and ∗∗p < 0.01). Each result represents the mean ± SD (n = 3-4).

