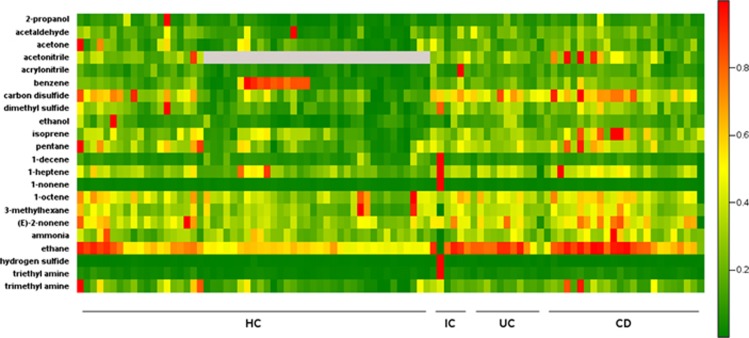
Figure 1.
Heat map depicting mass scans for the relative concentrations of examined volatile organic compounds (VOCs) in the breath of healthy controls (HCs), inflammatory controls (ICs), ulcerative colitis (UC) and Crohn's disease (CD) subjects. Red color depicts high and green color depicts low concentrations. OGD, other inflammatory GI diseases.

