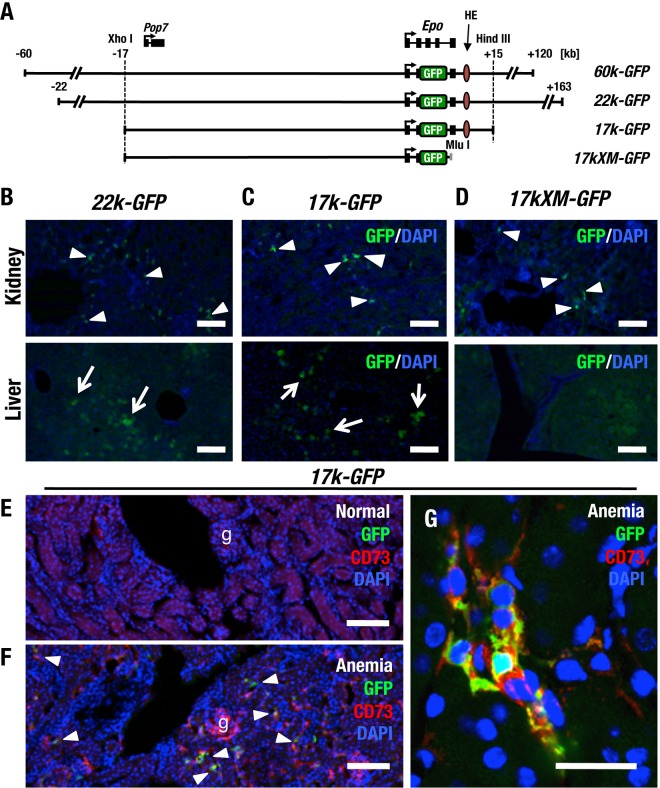
FIG 1.
A 17-kb upstream region recapitulates Epo gene expression in REP cells. (A) Diagram of transgenic constructs of 60k-GFP, 22k-GFP, 17k-GFP, and 17kXM-GFP. The locations of the Epo and Pop7 genes and restriction enzyme sites are depicted above the diagram. The MluI site was artificially inserted into the 3′ region of the GFP gene. (B to D) Immunohistochemical staining of GFP in the kidneys and livers of transgenic mice. Samples were derived from 22k-GFP (B), 17k-GFP (C), and 17kXM-GFP (D) transgenic mice under anemic conditions. REP cells are marked by GFP in the kidney sections from each transgenic mouse line (arrowheads). Note that GFP-positive cells were not observed in the livers of 17kXM-GFP mice but were observed in the livers of 22k-GFP and 17k-GFP mice (arrows). (E to G) GFP expression from 17k-GFP identifies REP cells in the kidney by double immunohistochemical staining with CD73. Note that REP cells seldom express GFP under normal conditions (E), whereas the number of GFP-positive cells increases under anemic conditions (F, arrowheads). g, glomerulus. (G) High-magnification images indicating that GFP-positive cells are REP cells also expressing CD73. Scale bars, 100 μm (B to F) and 25 μm (G).

