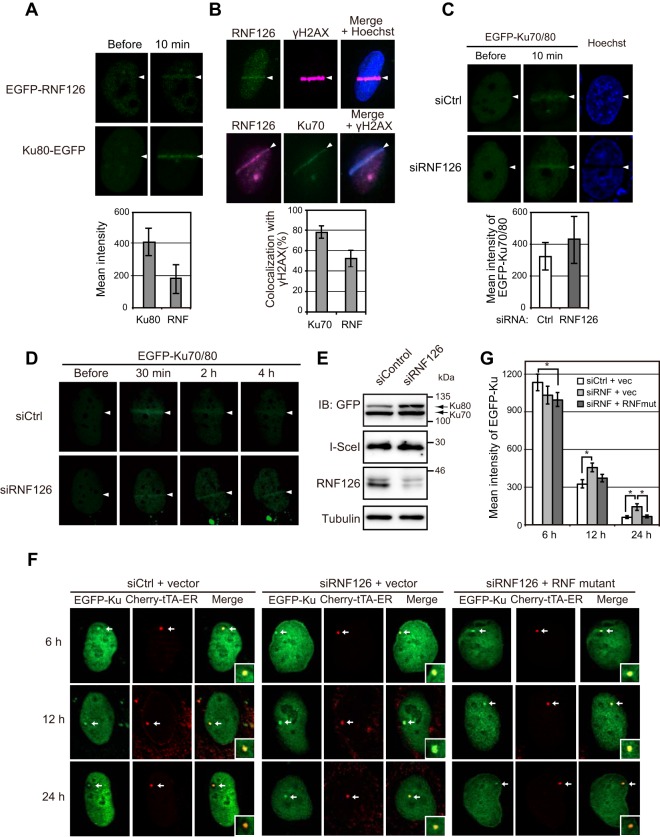
FIG 4.
RNF126 accumulates at DSB sites and regulates dissociation of Ku70/80 from sites of DNA damage. (A) U2OS cells expressing EGFP-tagged RNF126 or Ku80 were monitored for EGFP fluorescence before and 10 min after laser microirradiation. Arrowheads indicate the path of irradiation. The mean intensity of EGFP fluorescence at the sites of DNA damage after irradiation was determined as the means ± SEM for 10 cells. (B) U2OS cells were subjected to immunofluorescence analysis of endogenous RNF126, γH2AX, and Ku70 at 10 min after laser microirradiation. Nuclei were stained with Hoechst 33342 as indicated. The proportion of cells showing colocalization of endogenous Ku70 or RNF126 with γH2AX was determined as the means ± SEM for 20 cells. (C) U2OS cells that had been transfected with RNF126 or control siRNAs, as well as with expression vectors for EGFP-tagged Ku70 and Ku80, were monitored for EGFP fluorescence before and 10 min after laser microirradiation. The mean intensity of EGFP fluorescence at sites of DNA damage after irradiation was determined as the means ± SEM for 10 cells. (D) U2OS cells that had been transfected as described for panel C were monitored for EGFP fluorescence before and at the indicated times after laser microirradiation. (E) Immunoblot analysis of U2OS/TRE/I-SceI-19 cells that had been infected with an empty lentivirus, transfected with RNF126 or control siRNAs, and then subjected to electroporation with expression vectors for EGFP-tagged Ku70 and Ku80, I-SceI, and Cherry-tTA-ER. See Fig. S6A in the supplemental material for similar analysis of corresponding cells infected with a lentivirus encoding an siRNA-resistant form of RNF126. (F) Fluorescence microscopic analysis of U2OS/TRE/I-SceI-19 cells that had been infected with a lentivirus encoding an siRNA-resistant form of RNF126 (RNF mutant) or the corresponding empty virus (vector), transfected with RNF126 or control siRNAs, and then subjected to electroporation with expression vectors for EGFP-tagged Ku70 and Ku80, I-SceI, and Cherry-tTA-ER. The cells were examined at 6, 12, and 24 h after electroporation and exposure to tamoxifen to induce translocation of Cherry-tTA-ER to the nucleus. Arrows indicate DSB sites marked by Cherry-tTA-ER, higher magnification views of which are shown in the insets of the merged images. (G) Mean fluorescence intensity of EGFP-Ku70/80 at DSB sites was determined as the means ± SEM for 20 cells treated as described for panel F. vec, vector. *, P < 0.05 (Student's t test).

