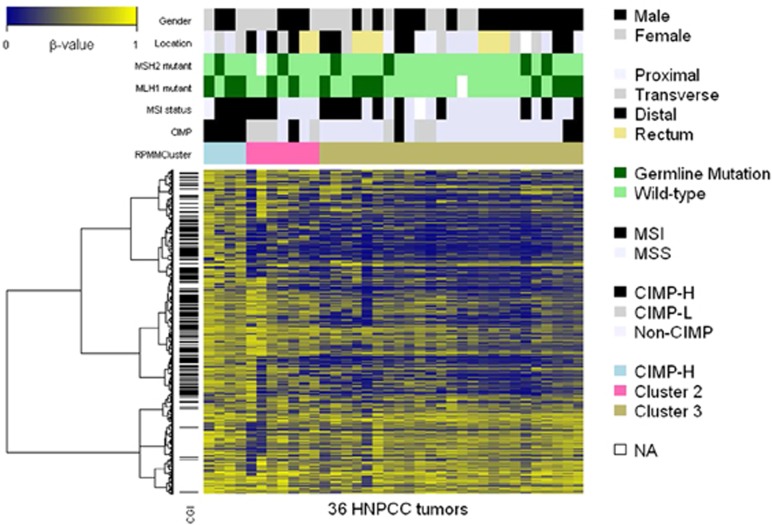
Figure 3.
Heatmap representation of three clusters using unsupervised RPMM clustering, based on the top 10% (2,758) most variable probes. Each of the 36 columns represents one of the 36 HNPCC tumors. The clinical and genetic characteristics of each tumor are marked in color at the top of the heatmap. Three clusters referring to the CIMP-H cluster, cluster 2, and cluster 3 are indicated by blue, pink, and khaki bars, respectively, in the top panel. The clinical and genetic characteristics of three clusters are summarized in Supplementary Table S7. Each row presents β-values over 36 HNPCC tumors for one of the 2,758 most variable probes, and the probe located within a CpG island is marked by a horizontal black bar on the left of the heatmap, whereas the DNA methylation level (β-value) is shown by a color scale ranging from blue (low level of DNA methylation) to yellow (high level of DNA methylation).

