Figure 3.
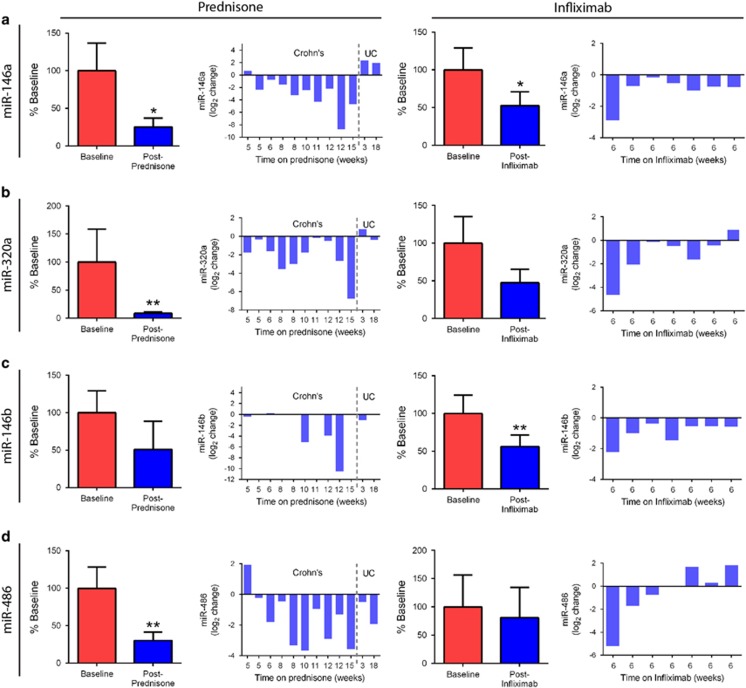
Serum microRNA levels change with prednisone or infliximab treatment. Levels of miRNAs were assayed by qRT-PCR. Bar graphs of the percent baseline levels for each treatment group, as well as change in expression for each individual patient, are provided for each miRNA. (a) miR-146a in response to prednisone (a) and infliximab (a'). miR-320a in response to prednisone (b) and infliximab (b'). miR-146b in response to prednisone (c) and infliximab (c'), note; four post-treatment and two baseline samples had miR-146b levels below detection threshold. (d) miR-486 in response to prednisone (d) and infliximab (d'). (*P<0.05, **P<0.01; paired t-test).

