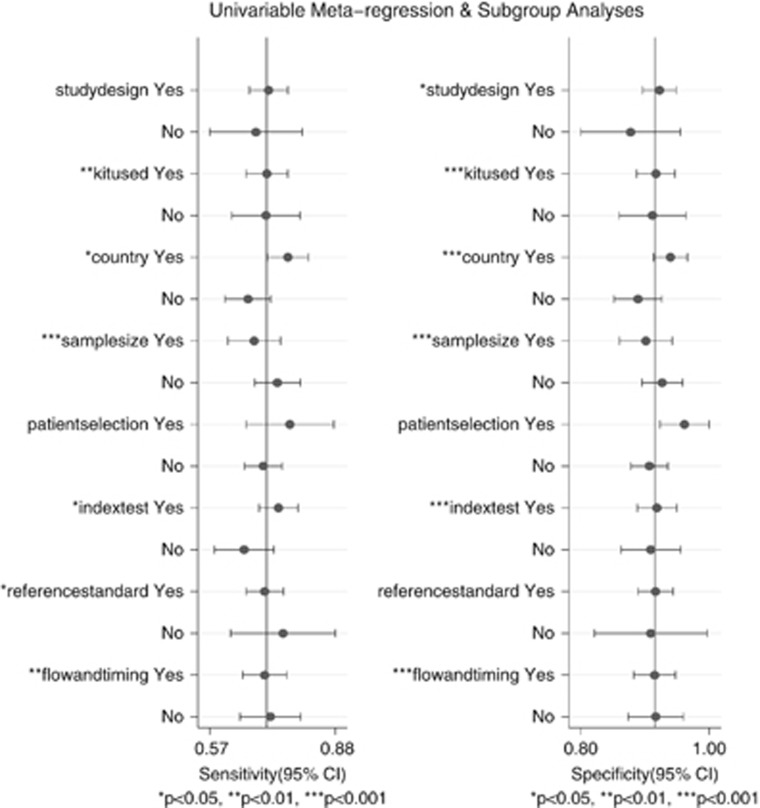
. 2017 Jan 19;8(1):e216. doi: 10.1038/ctg.2016.66
Copyright © 2017 The Author(s) the American College of Gastroenterology
Clinical and Translational Gastroenterology is an open-access journal published by Nature Publishing Group. This work is licensed under a Creative Commons Attribution-NonCommercial-NoDerivs 4.0 International License. The images or other third party material in this article are included in the article's Creative Commons license, unless indicated otherwise in the credit line; if the material is not included under the Creative Commons license, users will need to obtain permission from the license holder to reproduce the material. To view a copy of this license, visit http://creativecommons.org/licenses/by-nc-nd/4.0/

