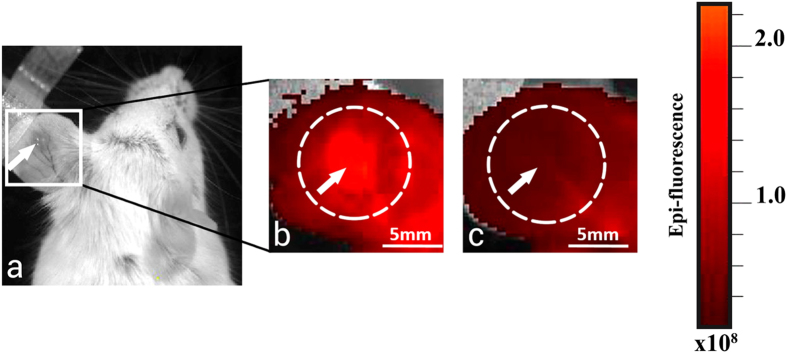
Figure 4. Fluorescence images of ear tumour model CT26.
(a) White-light photograph of mouse; (b) flourescene intensity 1 hour after PS injection (before PDT); (c) immediately after PDT (the treatment laser spot size was 5 mm). The tumour is marked by arrow; irradiation field is marked by the white dotted circle. Immediately after PDT, the fluorescence signal in the exposed area declined because of PS photobleaching.

