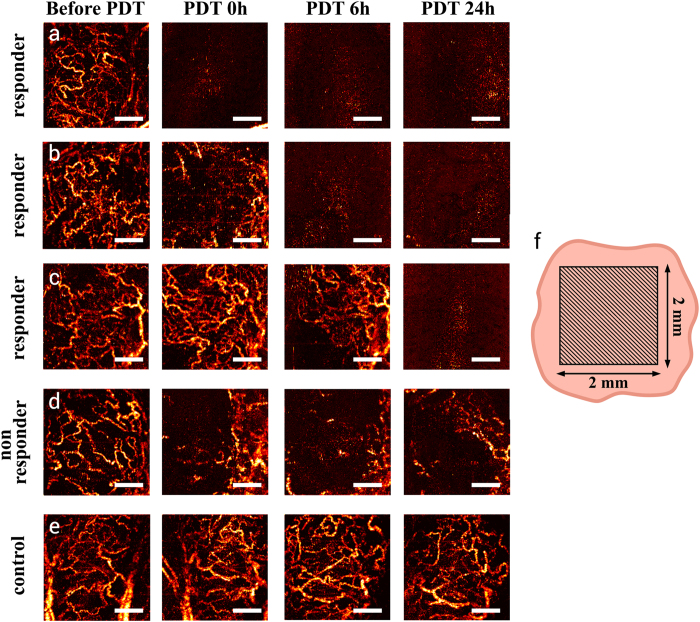
Figure 6. MML-OCA images of microvascular alteration dynamics prior to, immediately following, 6-hrs post, and a day after PDT (100 J/cm2, 100 mW/cm2).
A maximum intensity projection 2D display is shown for ease of comparison, representing a 3D data to a depth of ~1.3 mm. (a–c) – three separate examples of responding tumours, showing significant microvascular alterations within a day of treatment (or less); (d) example of a mildly responding tumour; (e) no microvascular changes were noted in the control animal; (f) schematic of MML-OCA scanning zone on the tumour (represented in 2D by the flesh-coloured irrelagular contour). Responding tumours’ microvascular inhibition as detected by MML-OCT at t < 24 hrs [(a–c)] was seen by histology (at t = 7 days) to result from blood vessels thrombosis and hemorrhage (Fig. 2). Scale bar = 500 μm on all images.

