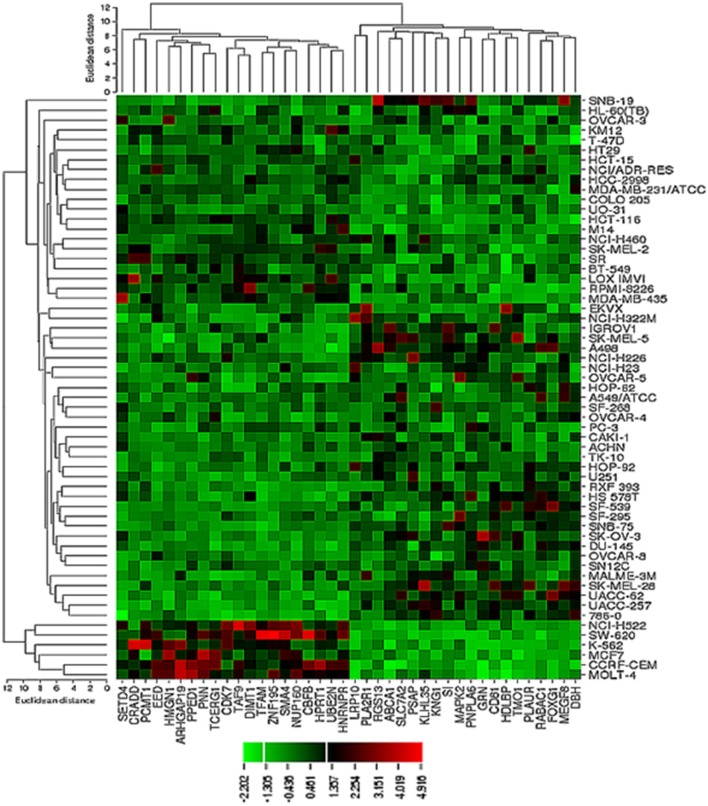
Figure 7.
Dendrograms and cluster image map of vitamin C obtained by hierarchical cluster analysis of mRNA expression of 40 genes in the NCI cell line panel as analyzed by the Novartis microarray platform. The dendrogram on the left shows the clustering of cell lines and the dendrogram on the top shows the clustering of genes. The cluster image map shows each single mRNA expression value obtained by microarray analysis. The expression values have been normalized and color-coded.

