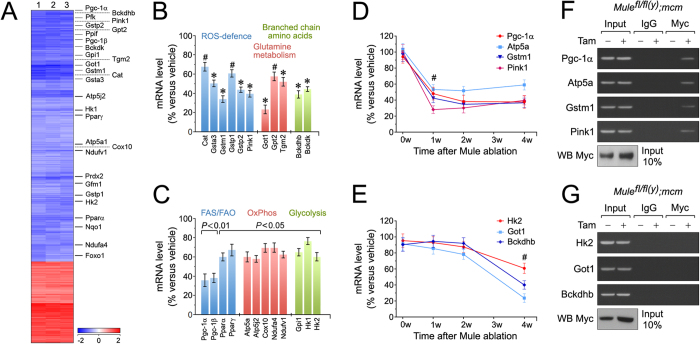
Figure 4. Mule inhibits Myc-dependent deterioration of cardiac function by downregulation of Pgc-1α and Pink1.
Microarray-based genome-wide transcriptional profiling of LV tissue samples derived from Mulefl/fl(y);mcm mice at 4 weeks post-Tam. Animals were 15 weeks old at the time of analysis. Depicted are differentially expressed genes that were significantly enriched for a cellular metabolic gene signature in the Mule-deficient mice (column) post-Tam relative to vehicle- injected controls. Heatmap values (log2 fold expression) of this metabolic gene set are shown by color and intensity of shading. Important factors of cardiac energy metabolism and detoxification of oxygen radicals are indicated on the right. Blue, repressed. Red, induced. n = 3 biological replicates. P < 0.01. Fold change >2.0. (A) Expression levels of key genes selected from (A), involved in the regulation of branched chain amino acid metabolism, glutamine metabolism and ROS defence as analyzed by RT-qPCR at 4 weeks post-Tam. n = 4. *P < 0.05 versus −Tam. #P < 0.01 versus vehicle. (B) Expression levels of differentially enriched genes from (A), involved in the regulation of glycolysis, mitochondrial oxidative phosphorylation (OxPhos), fatty acid synthesis (FAS) and fatty acid oxidation (FAO) as analyzed by RT-qPCR at 4 weeks post-Tam. n = 4. (D,E) Time course of transcript levels of selected factors (C) participating in the regulation of important biological processes in Mulefl/fl(y);mcm mice was analyzed by RT-qPCR. n = 4. #P < 0.01 versus vehicle. (F) Endogenous Myc interacts with gene promoter sequences of Pgc-1α, Atp5a, Gstm1 and Pink1 in situ. One representative result of three independent experiments is shown. (G) Myc does not bind to the promoters of Hk2, Got1 and Bckdhb. LV tissue obtained from Mulefl/fl(y);mcm mice at 7 d post-Tam was analyzed by ChIP employing anti-Myc antibodies and PCR primers specific to the selected gene promoters. Normal rabbit IgG were used for control immunoprecipitations. Input lanes of chromatin levels used for the immunoprecipitation step demonstrate equal loading. One representative result of three independent experiments is shown. Data are means ± s.e.m.

