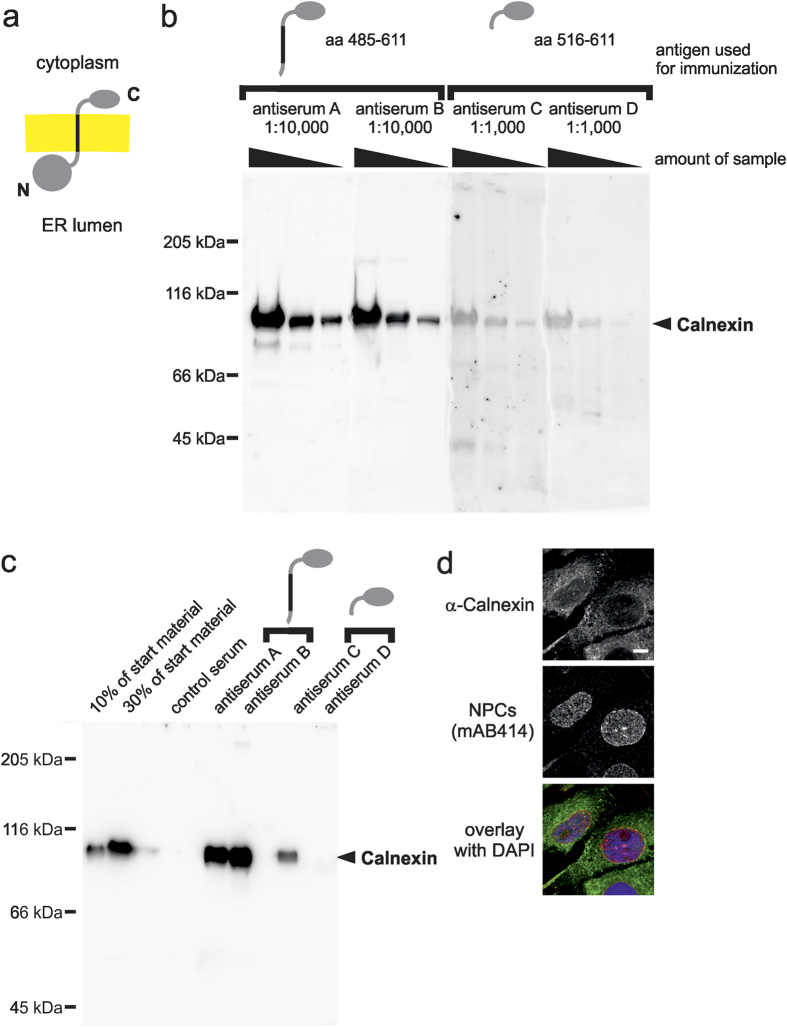
Figure 4. Characterization of Calnexin antisera.
(a) Schematic representation of Calnexin. The transmembrane region is indicated in black, the lipid bilayer in yellow. (b) 10 μg, 3 μg and 1 μg of a total membrane fraction from Xenopus egg extracts were separated on a 8% SDS-PAGE and analyzed by western blotting using antisera against a Calnexin fragment including its transmembrane region (aa 485–611, antiserum A and B) in a 1:10,000 dilution and antisera against the C-terminal cytoplasmic domain (aa 516–611 antiserum C and D) in a 1:1,000 dilution. Molecular size markers as well as the position of Calnexin are indicated. (c) Calnexin was immunprecipitated from a solubilized total membrane fraction from Xenopus egg extracts using antisera against a Calnexin fragment including its transmembrane region (antiserum A and B) and antisera against the C-terminal domain (antiserum C and D). Antibody bound proteins were eluated with SDS sample buffer and separated together with 10% and 30% of the corresponding starting material on a 8% SDS-PAGE. After western blotting samples were analyzed with α-Calnexin antiserum A. (d) Immunofluorescence detection of Calnexin. Xenopus S3 cells were fixed with 2% paraformaldehyde and stained with antiserum A. Samples were co-stained with the nuclear pore complex (NPC) marker mAB414 and DAPI and analyzed by confocal microscopy. Bar: 5 μm.

