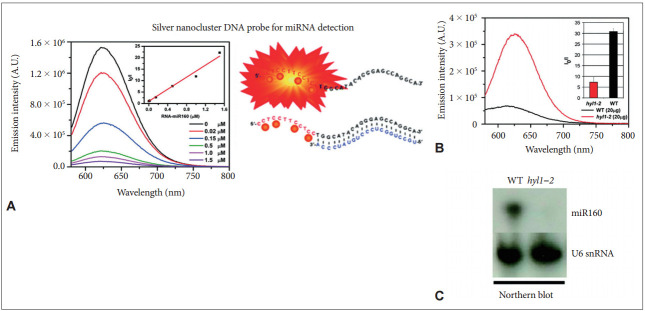
Figure 3.
Fluorescence intensity of the AgNCs formed in 12 nt-RED-160 probe with RNA-miR160 target in a concentration ranging from 0 to 1.5 μM. The fluorescence spectra were recorded, exciting at 560 nm. Emission spectra (excited at 560 nm) of AgNCs emission from a solution containing 1.5 μM of DNA-12 nt-RED-160 probe and 20 μg of endogenous RNA from WT (black curve) or hyl1-2 mutant Arabidopsis thaliana plants. Northern blot analysis shows the presence and absence of RNA miR160 in WT and hyl1-2 mutant plants. A: Fluorescence intensity of the AgNCs formed in 12 nt-RED-160 probe with RNA-miR160 target in a concentration ranging from 0 to 1.5 μM. The fluorescence spectra were recorded, exciting at 560 nm. B: Emission spectra (excited at 560 nm) of AgNCs emission from a solution containing 1.5 μM of DNA-12 nt-RED-160 probe and 20 μg of endogenous RNA from WT (black curve) or hyl1-2 mutant Arabidopsis thaliana plants. C: Northern blot analysis shows the presence and absence of RNA miR160 in WT and hyl1-2 mutant plants, respectively. Adapted from Yang et al. Anal Chem 2011;83:6935-6939, with permission of American Chemical Society [10]. AgNCs: silver nanoclusters, WT: wild-type.

