
Figure 2. Kaplan-Meier curves of recurrence-free survival.
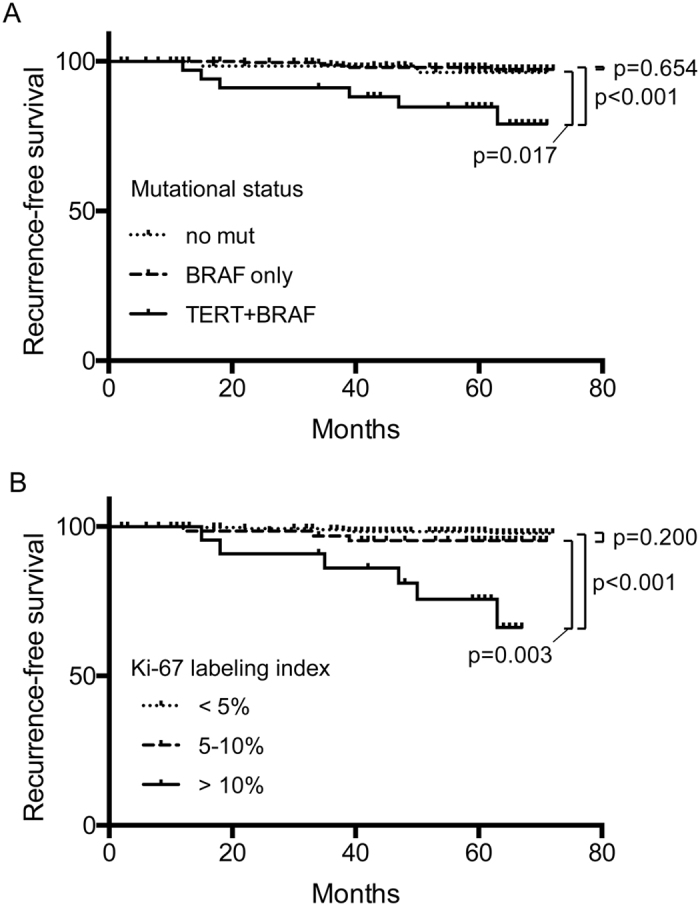
The vertical tick-marks correspond to censored data. p-values of a log-rank test are shown. (A) by mutational status. (B) by Ki-67 labeling index.
Official websites use .gov
A
.gov website belongs to an official
government organization in the United States.
Secure .gov websites use HTTPS
A lock (
) or https:// means you've safely
connected to the .gov website. Share sensitive
information only on official, secure websites.
The vertical tick-marks correspond to censored data. p-values of a log-rank test are shown. (A) by mutational status. (B) by Ki-67 labeling index.