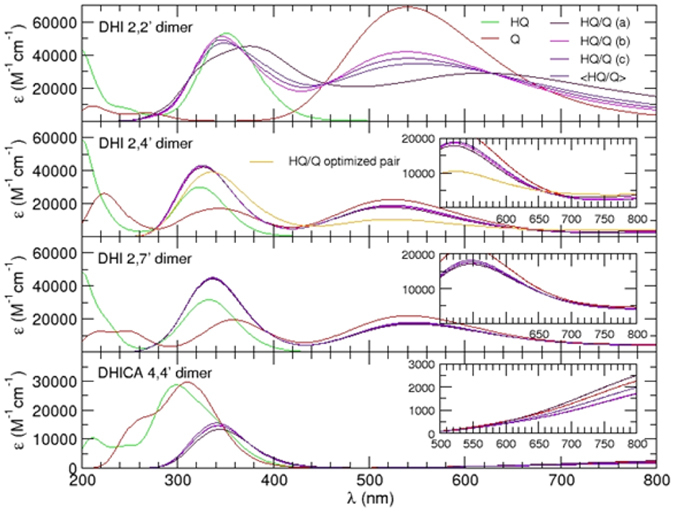
Figure 8. Computed absorption spectra for the HQ (green), Q (red) and HQ/Q (indigo, averaged over three conformers) species of the investigated dimers.

The absorption of each HQ/Q stacked conformer at short (a), minimum (b) and large (c) distance, is reported separately. In the insets, the visible region between 500 and 800 nm is highlighted.
