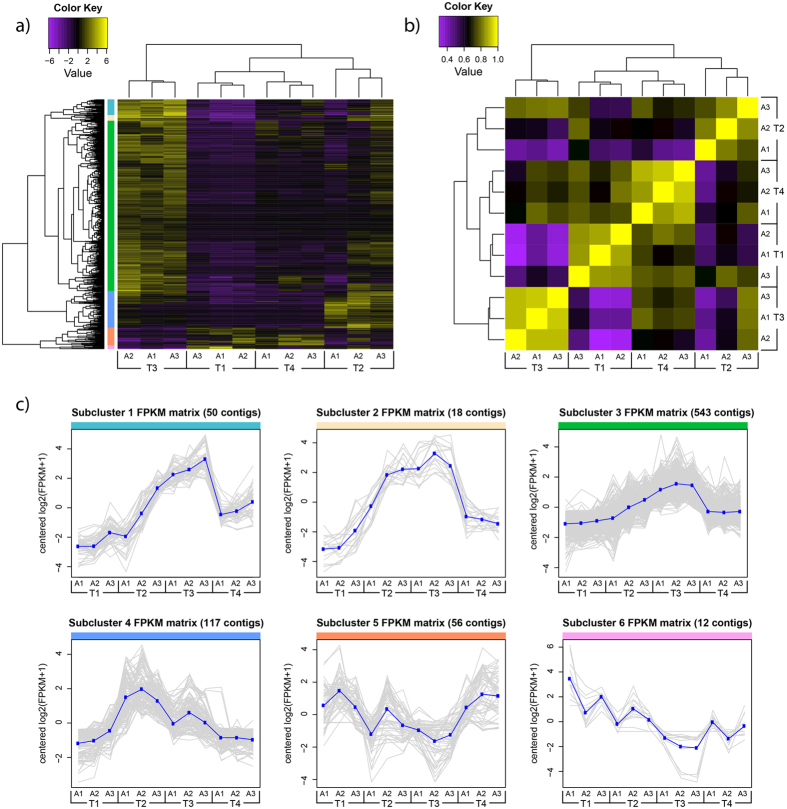
Figure 3. Heat map and sample correlation matrix of differentially expressed genes following injury of Calliactis polypus.
(a) Heat map showing the RNA-Seq expression levels of 796 differentially expressed contigs (log2 |FC| ≥2, FDR ≤ 0.01, n = 3) across the four time points. Expression values are log2-transformed median-centred FPKM. Yellow and purple colour intensity indicate contig upregulation and downregulation, respectively. Dendrogram clustering on the X-axis indicates sample similarity, whereas dendrogram clustering on the Y-axis groups contigs with similar expression profiles over time. Coloured bars on the Y-axis correspond to subclusters shown in (c). (b) Sample correlation matrix displaying the overall similarity in expression profile for each sample at the four different time points. Yellow colour intensity indicates increasing sample correlation, whereas purple colour intensity indicates decreasing sample correlation. Dendrogram clustering on the X and Y-axis indicates the overall similarity of these samples. (c) Contigs with similar RNA-Seq expression patterns were subclustered by cutting the Y-axis dendrogram of (a) at 50% of its height, resulting in 6 subclusters. Each contig’s expression, measured in log2-transformed median-centred FPKM, is plotted in grey, with the mean expression profile for each cluster plotted in blue. Coloured bars lining the top of each graph correspond to the sections indicated on (a). T1–T4; time 1 – time 4 (0 hrs, 3 hrs, 20 hrs, 96 hours post sectioning), A1–A3; anemone 1 – anemone 3, FPKM; fragments per kilobase of transcript per million mapped reads.

