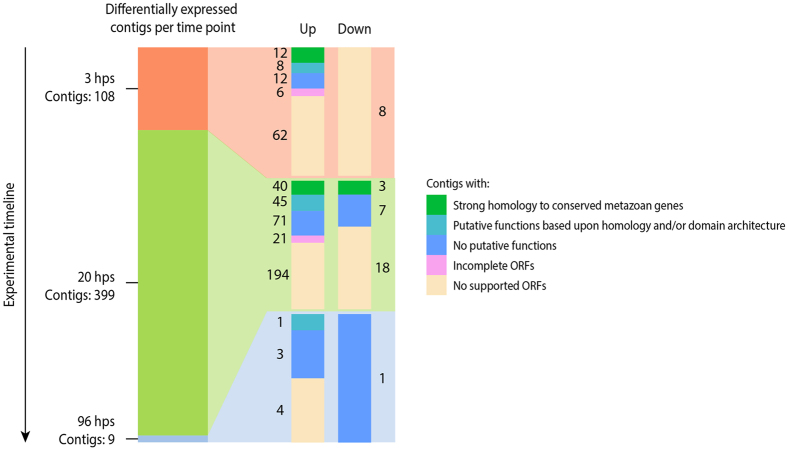
Figure 4. Number and type of differentially expressed contigs at the three treatment time points when compared to baseline expression.
The leftmost bar represents the number of differentially expressed contigs at its labelled time point, with the rightmost paired bars representing the number of contigs with relation to their expression status (up or down) and the type of contig as noted in the legend. hps; hours post sectioning, ORF; open reading frame.

