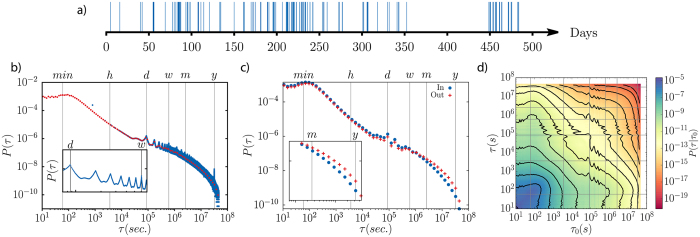
Figure 1.
In (a), typical activity pattern for a directed link of two generic Twitter users. Each vertical tick represents a directed message. The inter-event time τ corresponds to the separation between two consecutive ticks. In (b), inter-event time distribution for all the users. Blue and red dots represent the lin- and log-binned scales in the τ axis. The localized maxima in the tail of the distribution correspond to circadian rhythms, as shown in the bottom inset. In (c) the inter-event time distributions for internal and external links to the communities detected with Infomap are displayed. The inset shows the detail of the tail of the distributions. In (d), colormap depicting the conditional probability of two consecutive inter-event times. Equiprobable lines are shown on top, evenly spaced in the log-scale from probabilities of 10−5 to 10−18.

