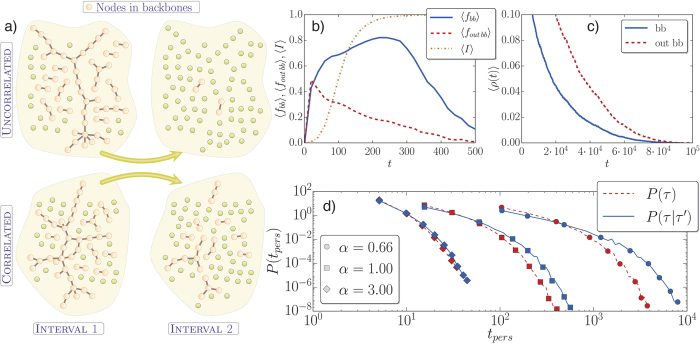
Figure 3.
In (a), sketch of the persistence of the backbones in two consecutive intervals. The network is random and with 75 nodes, 〈k〉 = 6, and the link activation is simulated with α = 0.2. In (b), the average fractions of links contributing to the spreading in the backbone and outside the backbone is displayed for the SI as a function of time. In the background, the average fraction of infected nodes 〈I〉 is depicted to provide a guide on the global state of the outbreak. In (c), the average number of active interfaces inside and outside the backbones for the voter model. In (b,c), the averages are taken over 1000 realizations in networks of 2000 nodes, the inter-event times are uncorrelated P(τ) with α = 0.75. In (d), persistence probability of the consecutive time spent by a link belonging to a backbone. The time interval is different for different values of α but it is the same for the correlated and uncorrelated cases. Simulations are done in Erdös-Rényi networks of 1000 nodes and 〈k〉 = 12, averaged over 100 realizations.

