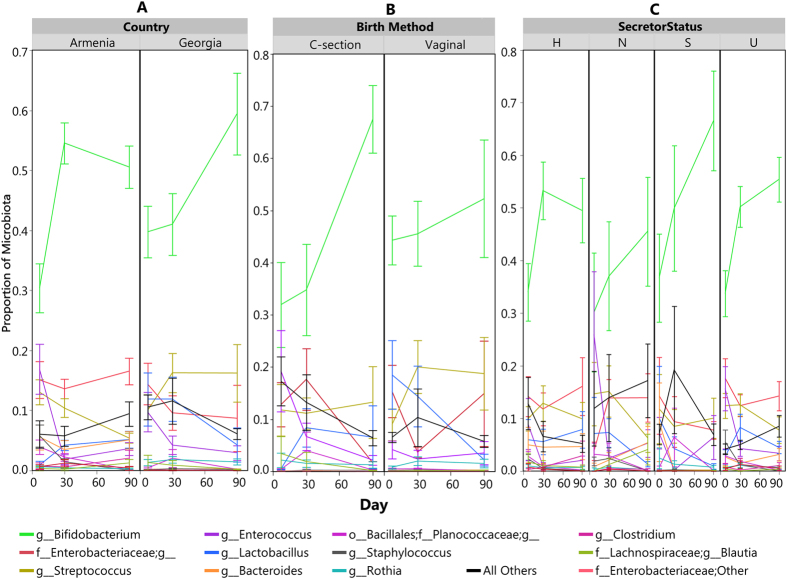
Figure 2. Members of the infant gut microbiome with greater than 0.05% average relative abundance over time based on proportion of sequencing reads.
Error bars are standard error. (A) Average proportion of major gut microbes by country. (B) Average proportion of major gut microbes by birth method. (C) Average proportion of major gut microbes by mother’s secretor status. H = heterozygote, S = homozygote secretor, N = non-secretor, U = unknown.

