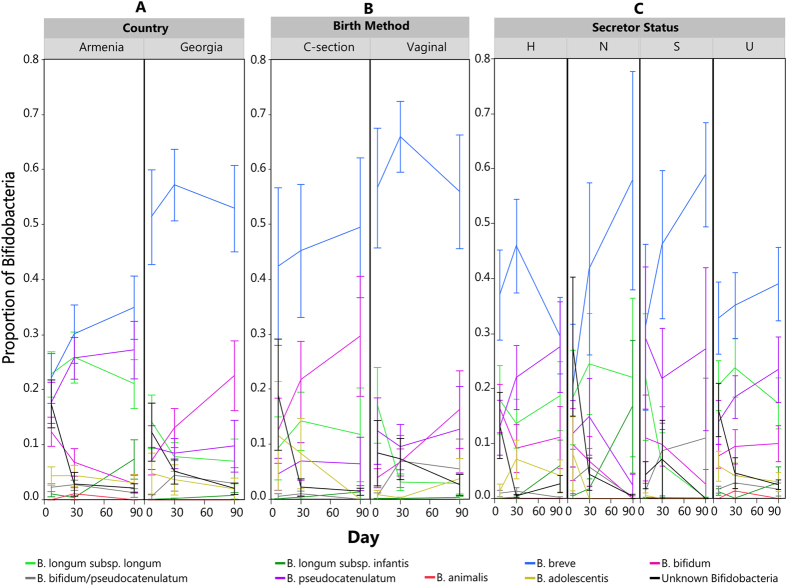
Figure 3. Average relative abundance of each member within the genus Bifidobacterium over time, based on the Bif-TRFLP/BLIR data.
Error bars are standard error. (A) Average proportion of bifidobacteria by country. (B) Average proportion of bifidobacteria by birth method. (C) Average proportion of bifidobacteria by mother’s secretor status. H = heterozygote, S = homozygote secretor, N = non-secretor, U = unknown.

