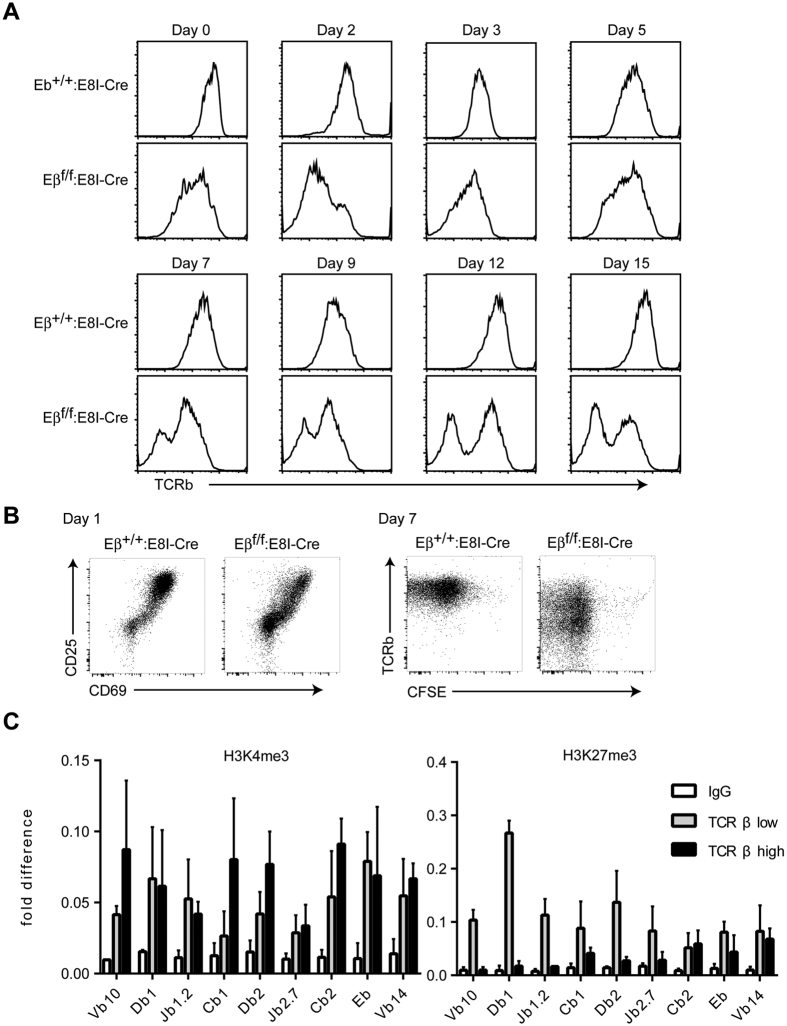
Figure 4. Kinetics of TCRβ expression in the absence of the Eβ after TCR stimulation.
(A) Splenic CD8+ T cells from Eβ +/+:E8I-Cre and Eβ f/f:E8I-Cre mice were stimulated with immobilized anti-CD3 and soluble anti-CD28 antibodies. Two days after stimulation, cells were harvested and were kept in culture with medium supplemented with 20 units/ml of mIL-2. TCRβ expression kinetics after stimulation are shown as histograms. (B) Dot plots showing CD25 and CD69 activation markers, and TCRb expression and CFSE as a marker for cell proliferation at the indicated days. (C) ChIP assay measuring H3K4 and K27 tri-methylation levels at indicated regions in the Tcrb locus in TCRβ− and TCRβ+ cells, which were prepared at 12 days after TCR stimulation. Combined data from three independent ChIP experiments is shown.

