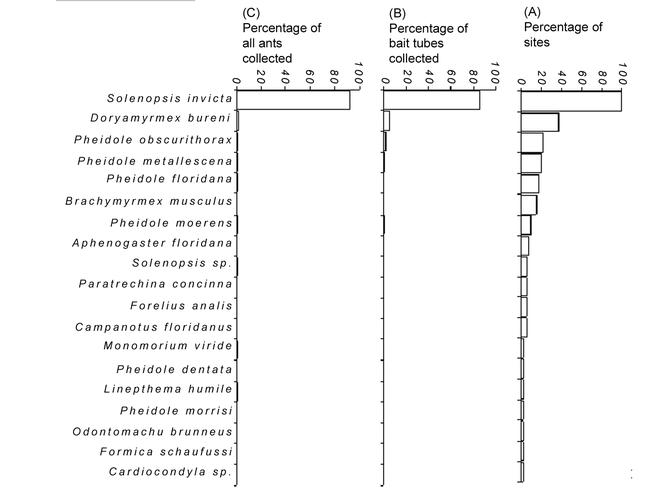
Figure 2.

Collection frequencies of 19 bait-collected ant species. (a) Percentage of sites (n = 41) at which each species was collected. (b) Percentage of all bait tubes (n = 1733) that captured each species. (c) Percentage of all ants collected (n = 86,681). Each representation of collections shows a typical pattern of one or a few common and many rare species.
