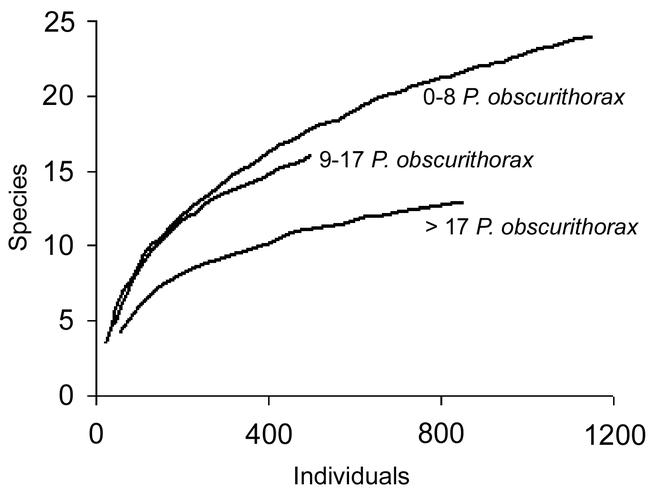
Figure 5.

Rarefaction curves for pitfall-trap study. Curves represent the expected number of species per pitfall trap for three categories of Pheidole obscurithorax abundance and were determined by resampling of each data set 50 times without replacement for each category. Pitfall traps that capture the greatest number of P. obscurithorax are expected to capture the smallest number of species.
