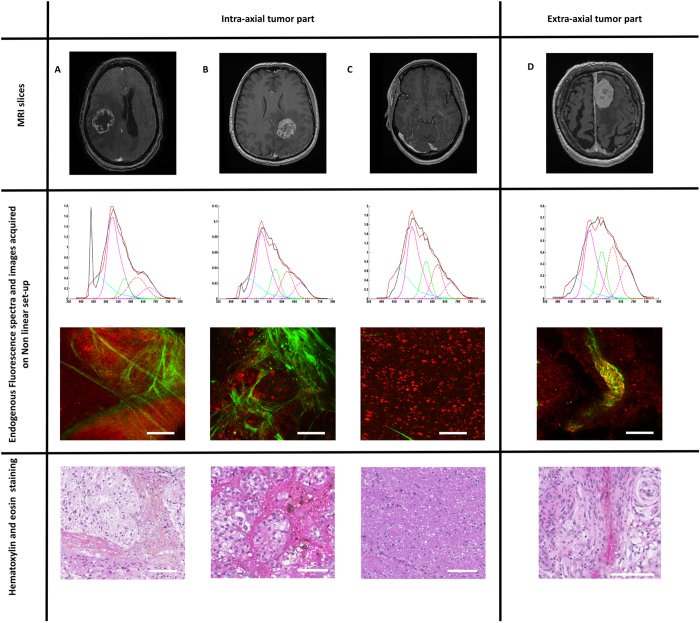
Figure 5.
Multimodal analysis of intra and extra- axial tumor analysis of glioma (A) and metastasis (B) samples versus control samples (C) and meningioma control sample (D). From top to bottom: Axial MR slice on contrast enhanced T1-weighted sequence. Spectra at 890 nm excitation wavelength from nonlinear set-up showing a clear peak of SHG at 445 nm. Image from nonlinear set-up showing SHG signal in green and fluorescence in red. Hematoxylin-Eosin staining Images. Scale bars: 100 μm. Spectra analysis: X-axis: emission wavelength (nm) and Y-axis: Fluorescence intensity (a.u.); Fitted by Matlab software: blue, purple and green line represent respectively NADH, FAD and lipopigment fluorescence emission spectra. Red and purple dot lines for porphyrin I and porphyrin II.

