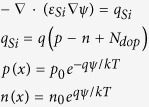
Table 1. The equations used for modeling the regions of the sensor system.
| Si body | oxide | Sensor liquid interface | Liquid |
|---|---|---|---|
 n0 = 1010 cm−3,p0 = 1016 cm−3εSi = 11.9 ε0 n0 = 1010 cm−3,p0 = 1016 cm−3εSi = 11.9 ε0
|
Gate oxide:  εSiO2 = 3.9ε0Sensing oxide: εSiO2 = 3.9ε0Sensing oxide:  εAl2o3 = 9ε0 εAl2o3 = 9ε0
|
  Na = 8 × 1014 cm−2 (Ka, Kb) = (6, 10) Na = 8 × 1014 cm−2 (Ka, Kb) = (6, 10) |
   vi = 2a3ciB,ciB = 50 mM, εw = 80ε0
|
Where εSi, εSiO2, εw, εAl2o3, εware the relative permittivity of silicon, gate oxide, sensing oxide and water respectively, ε0 is the vacuum permittivity. In column 1, P(x) and n(x) are the silicon hole and electron concentrations with the initial value of p0 and n0, qSi is the total charge in bulk silicon, Ndop is the substrate doping. In column 3, σ0 is the sensing oxide surface charge density, aHs is the activity of hydrogen ion at the sensing oxide surface, Ka and Kb are in order the oxide association and dissociation constant and Na is the oxide surface charge density. In column 4, qliq is the solution total charge, ci is the ion i concentration in solution with the bulk concentration of ciB. zi is the ion i charge number, ai is the ion i effective hydrated size and vi is the ion i packing parameter.
